Correction: An earlier version used stale kindergarten, grade-level and county values and included unsupported projections. This version uses the current published 2011-2026 panel and limits the interpretation to what the enrollment data establish.
West Virginia enrolled 21,245 kindergartners in 2011 and 15,781 in 2026. The decline is 5,464 students, or 25.7%.
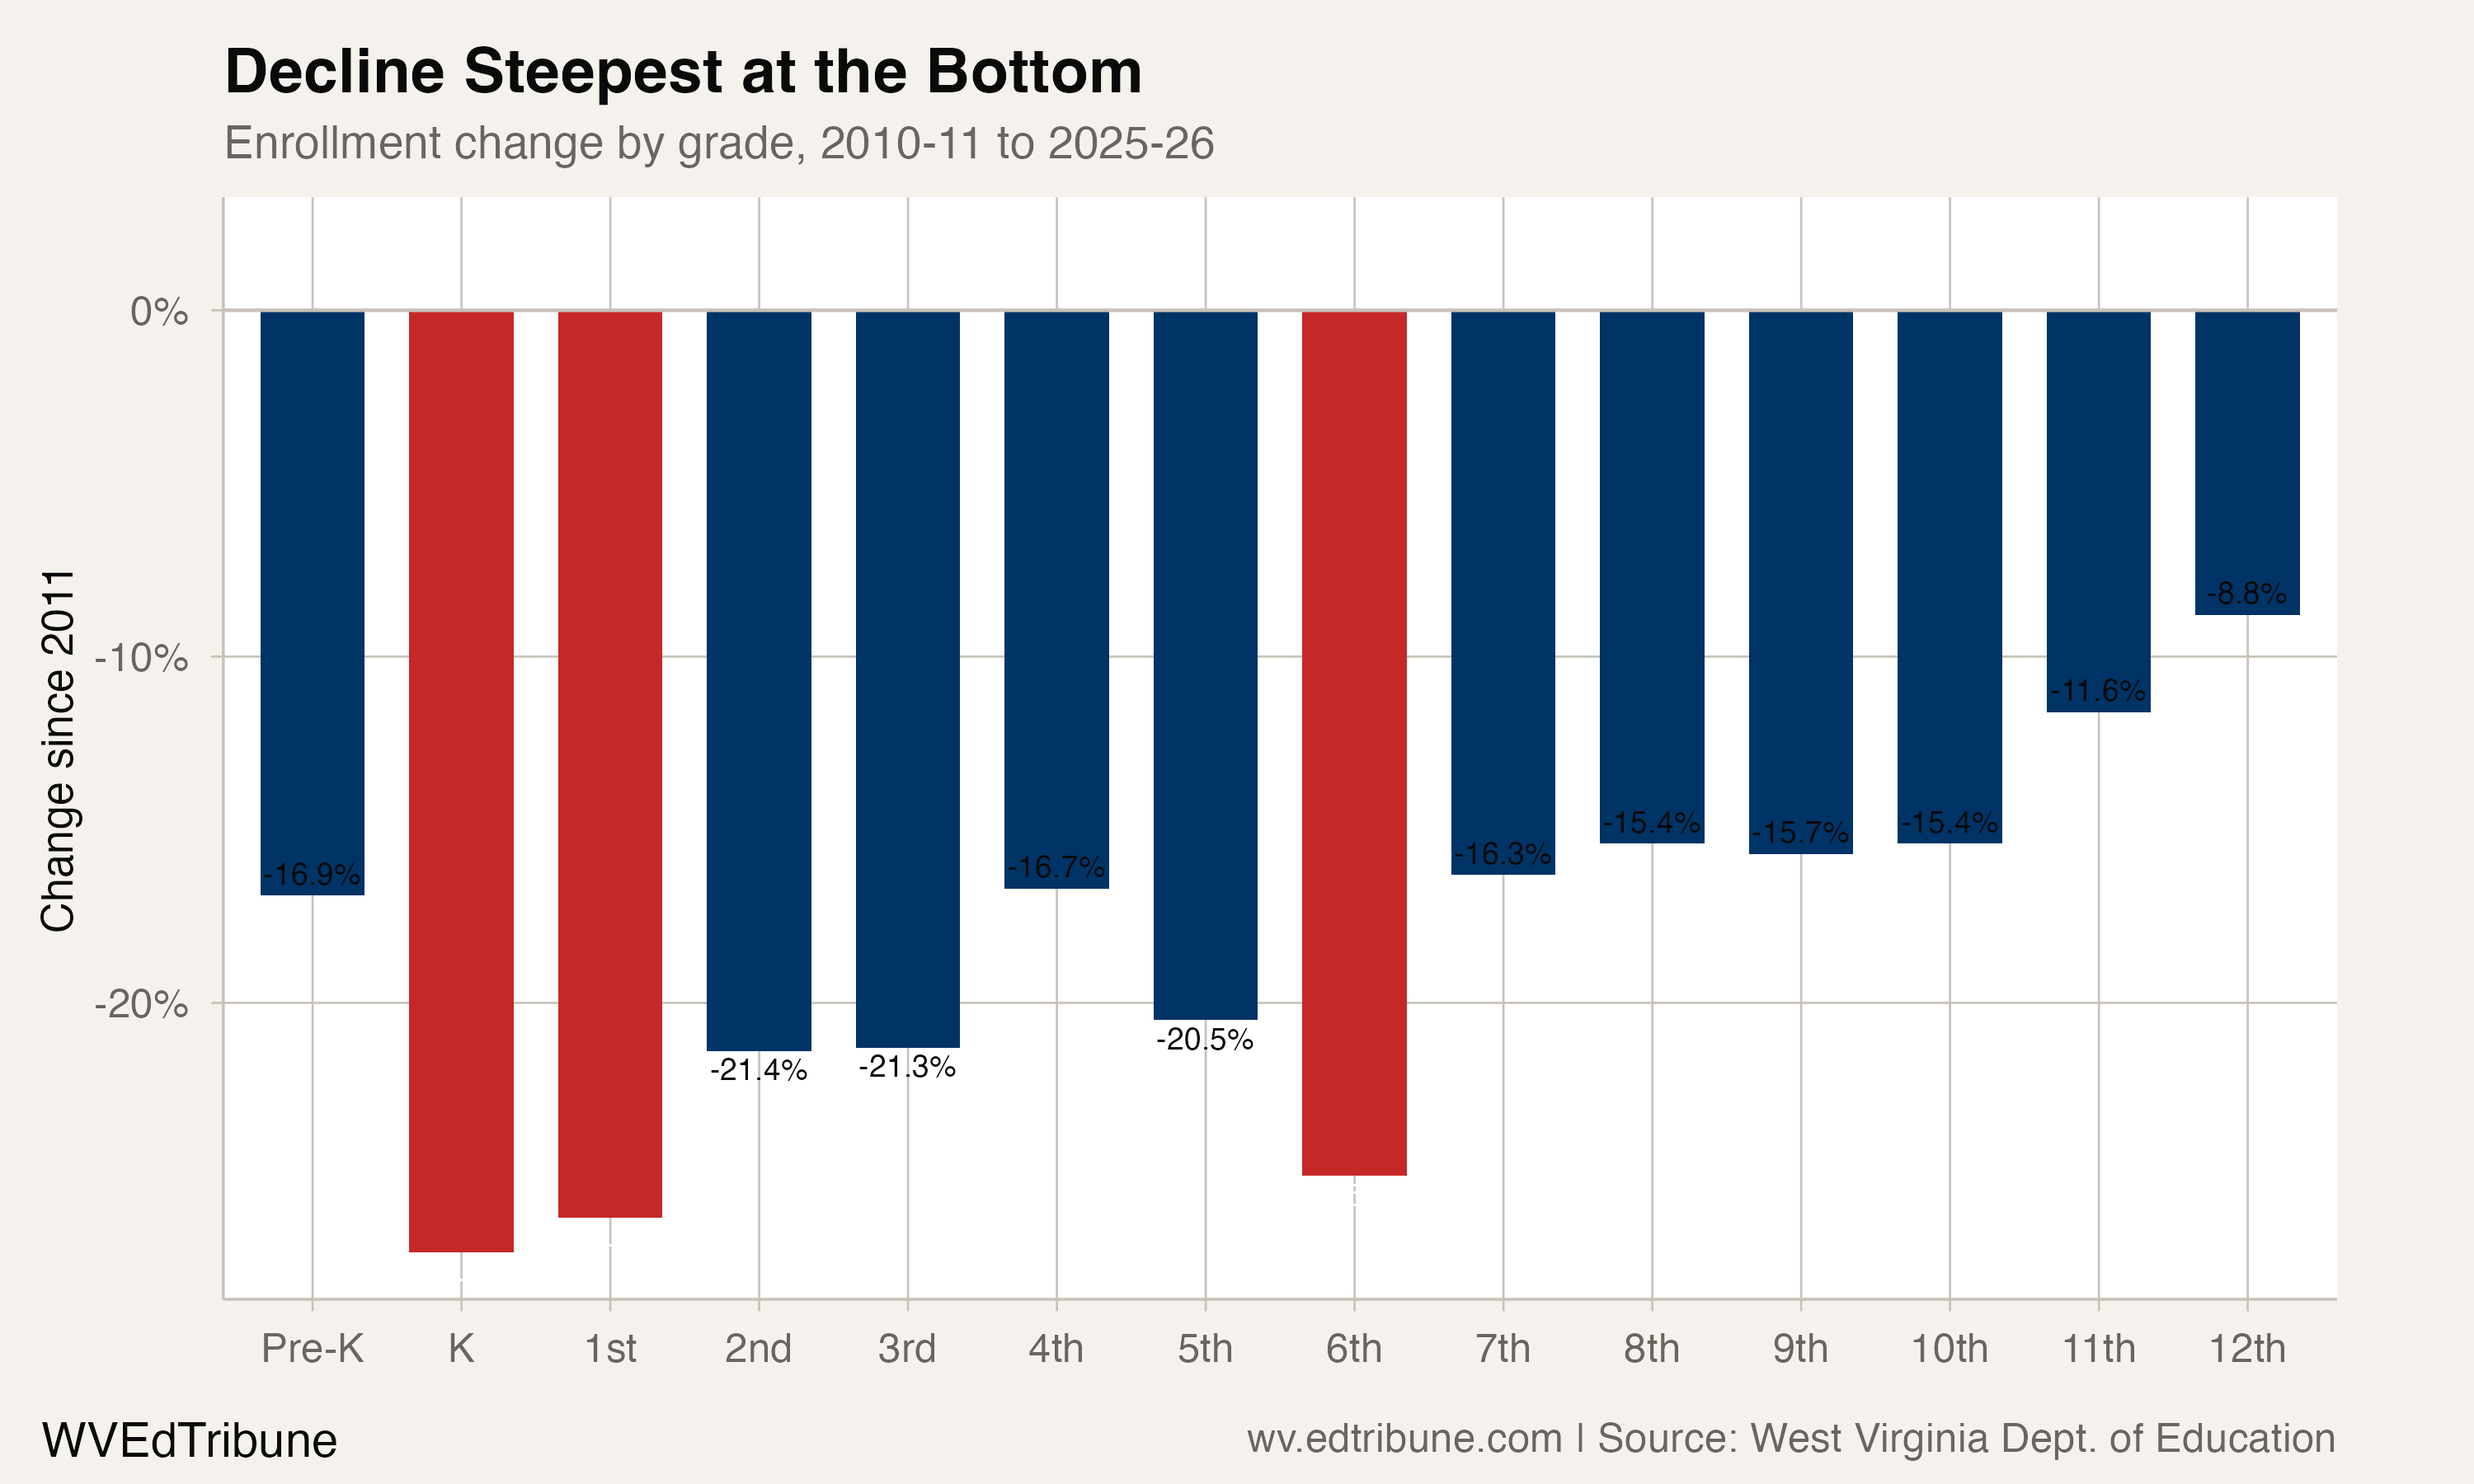
The statewide total fell from 282,130 students to 234,957, a 16.7% decline. The contrast is sharper across the grade spine: first grade fell 24.8%, sixth grade fell 23.7%, while grade 12 fell 6.3%.
The panel describes different-sized grade groups at different points in time. It does not track a single cohort or forecast the enrollment of a future graduating class.
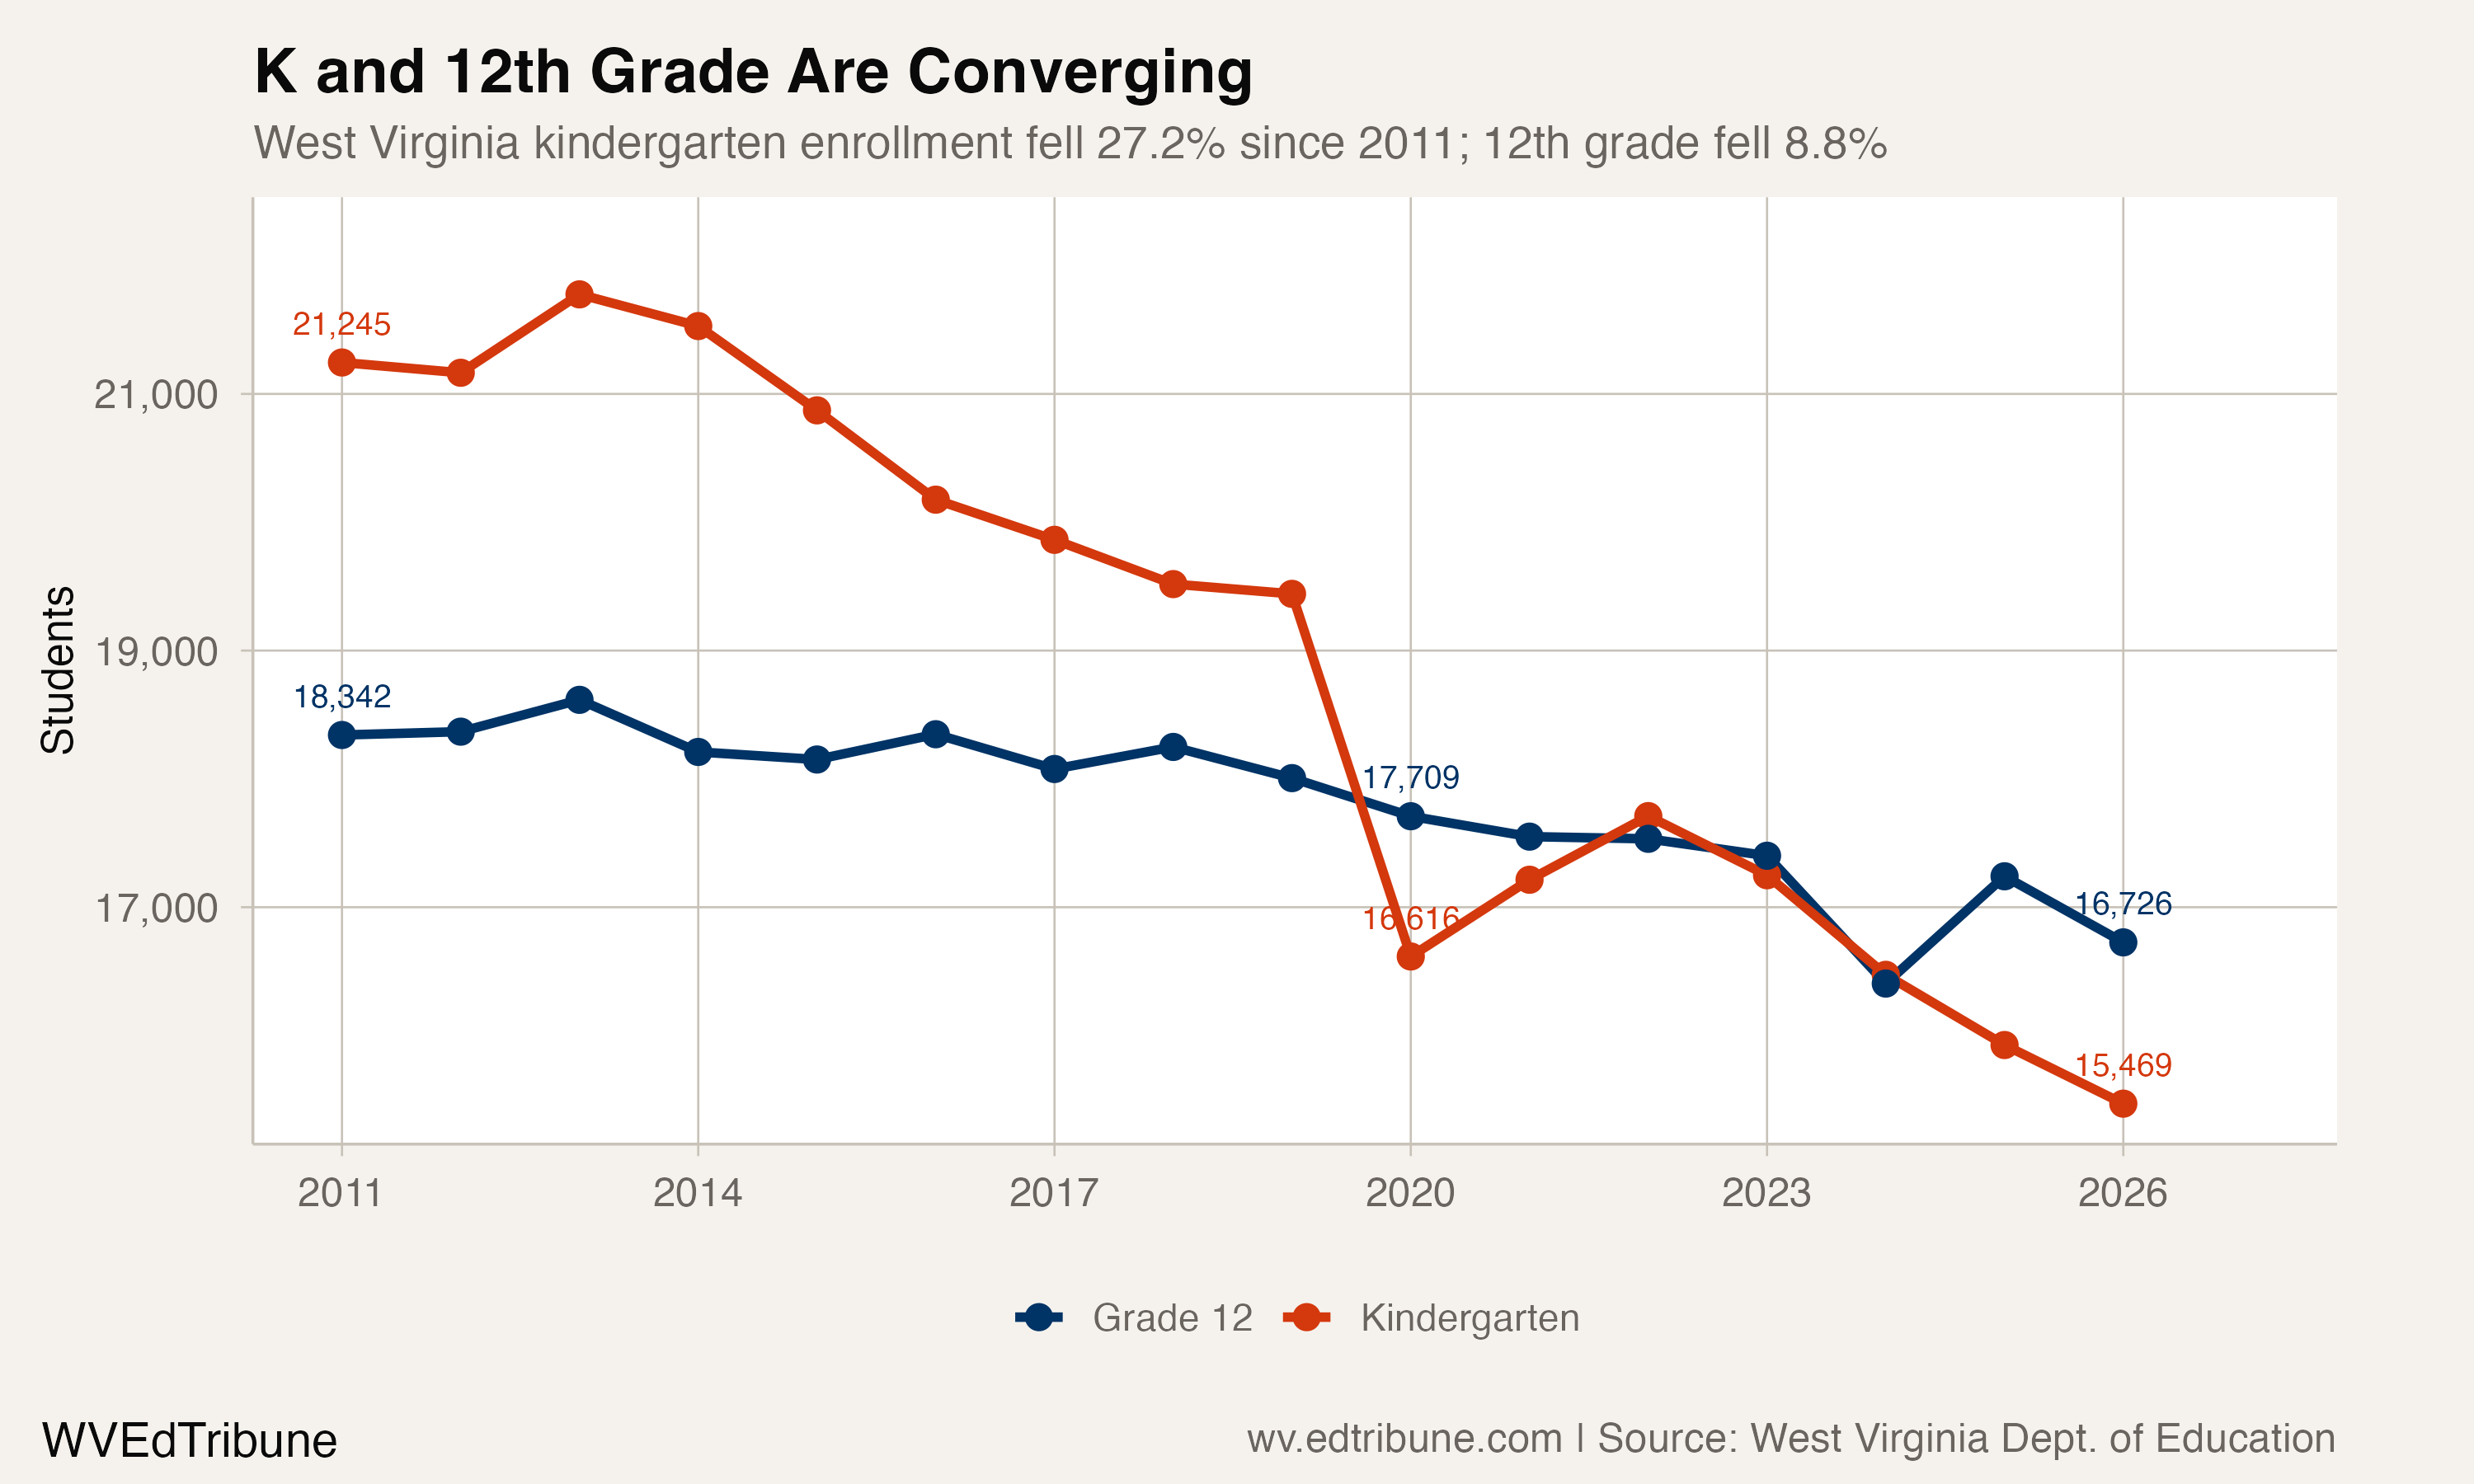
Kindergarten and grade 12 changed positions
In 2011, kindergarten exceeded grade 12 by 2,903 students. The relationship did not move in one direction. Grade 12 led kindergarten by 1,096 students in 2020; kindergarten led again by 177 in 2022; and grade 12 led by 1,406 in 2026.
That sequence is a series of same-year comparisons, not evidence that one group of children was followed from kindergarten to graduation. It does show how the relative size of the two ends of the published grade panel changed.
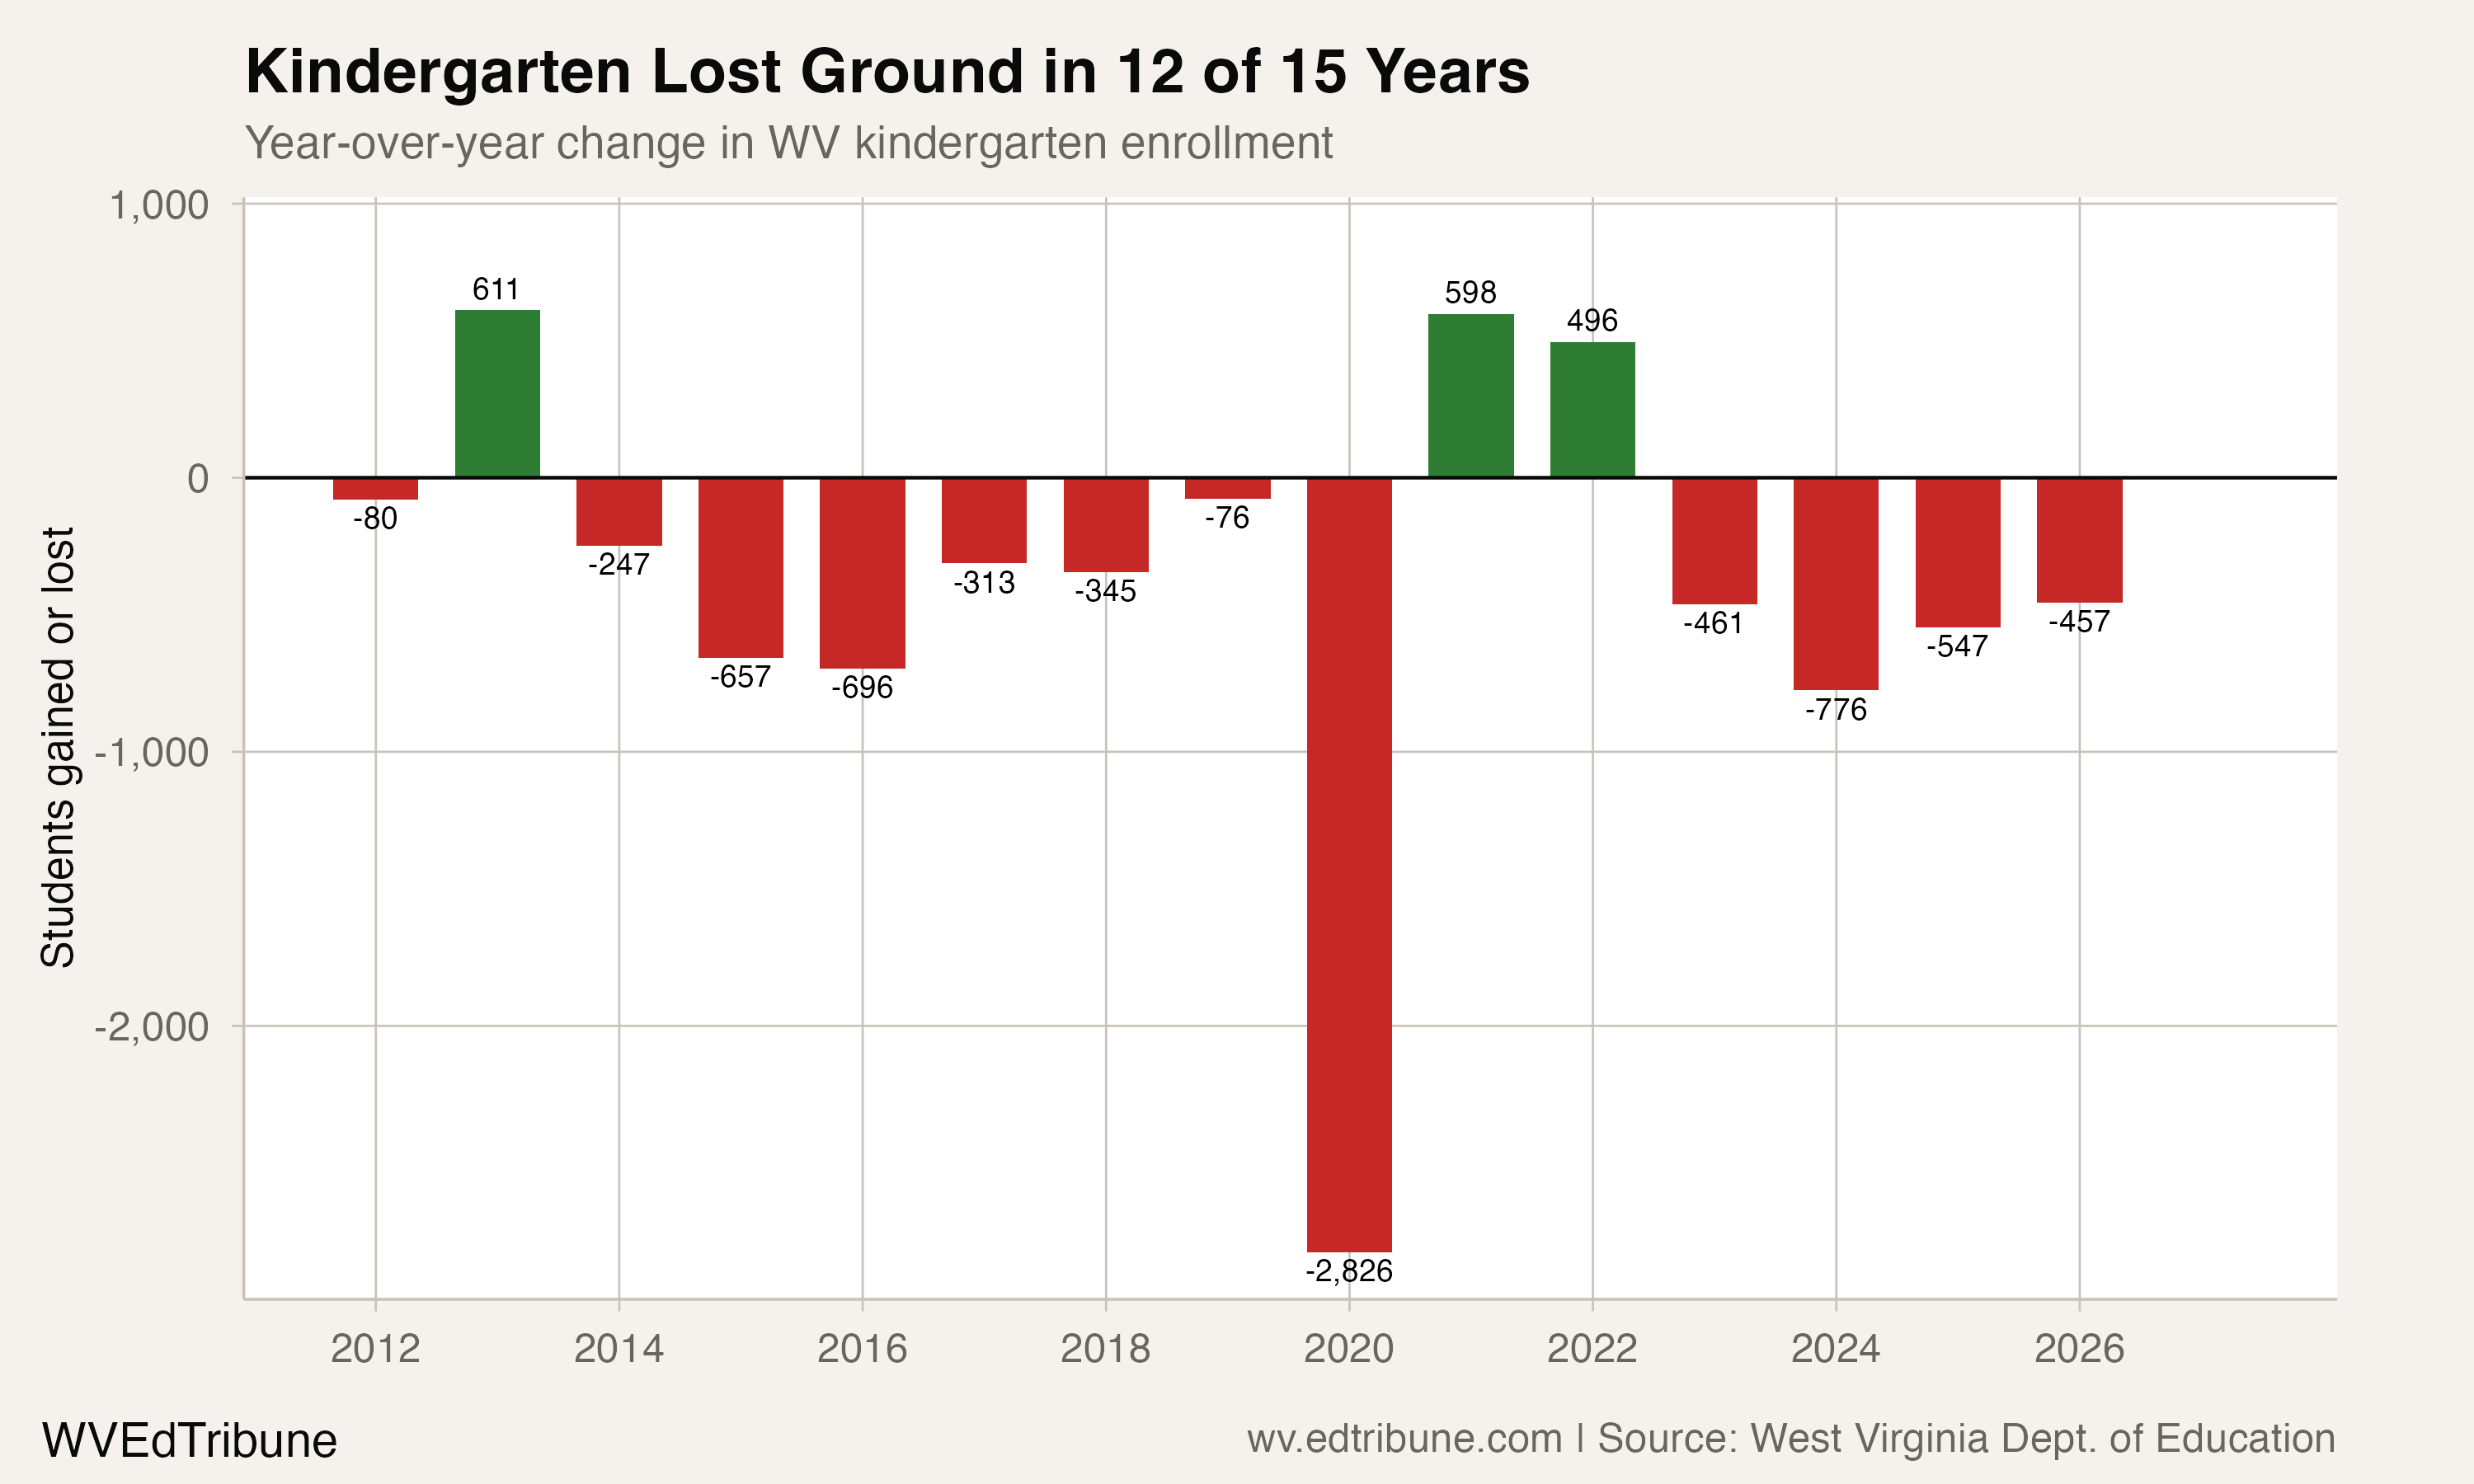
A sharp drop, a brief recovery, then four losses
Kindergarten enrollment fell by 2,823 students in 2020, a 14.5% one-year decline. It rose by 595 in 2021 and 496 in 2022, but fell in each of the next four years.
Those four annual losses totaled 1,929 students. The sequence was 270 fewer in 2023, 759 fewer in 2024, 518 fewer in 2025 and 382 fewer in 2026.
The numbers establish the timing of the decline. The enrollment panel does not establish whether births, migration, transfers, grade repetition, reporting changes or movement between school sectors caused any particular change.
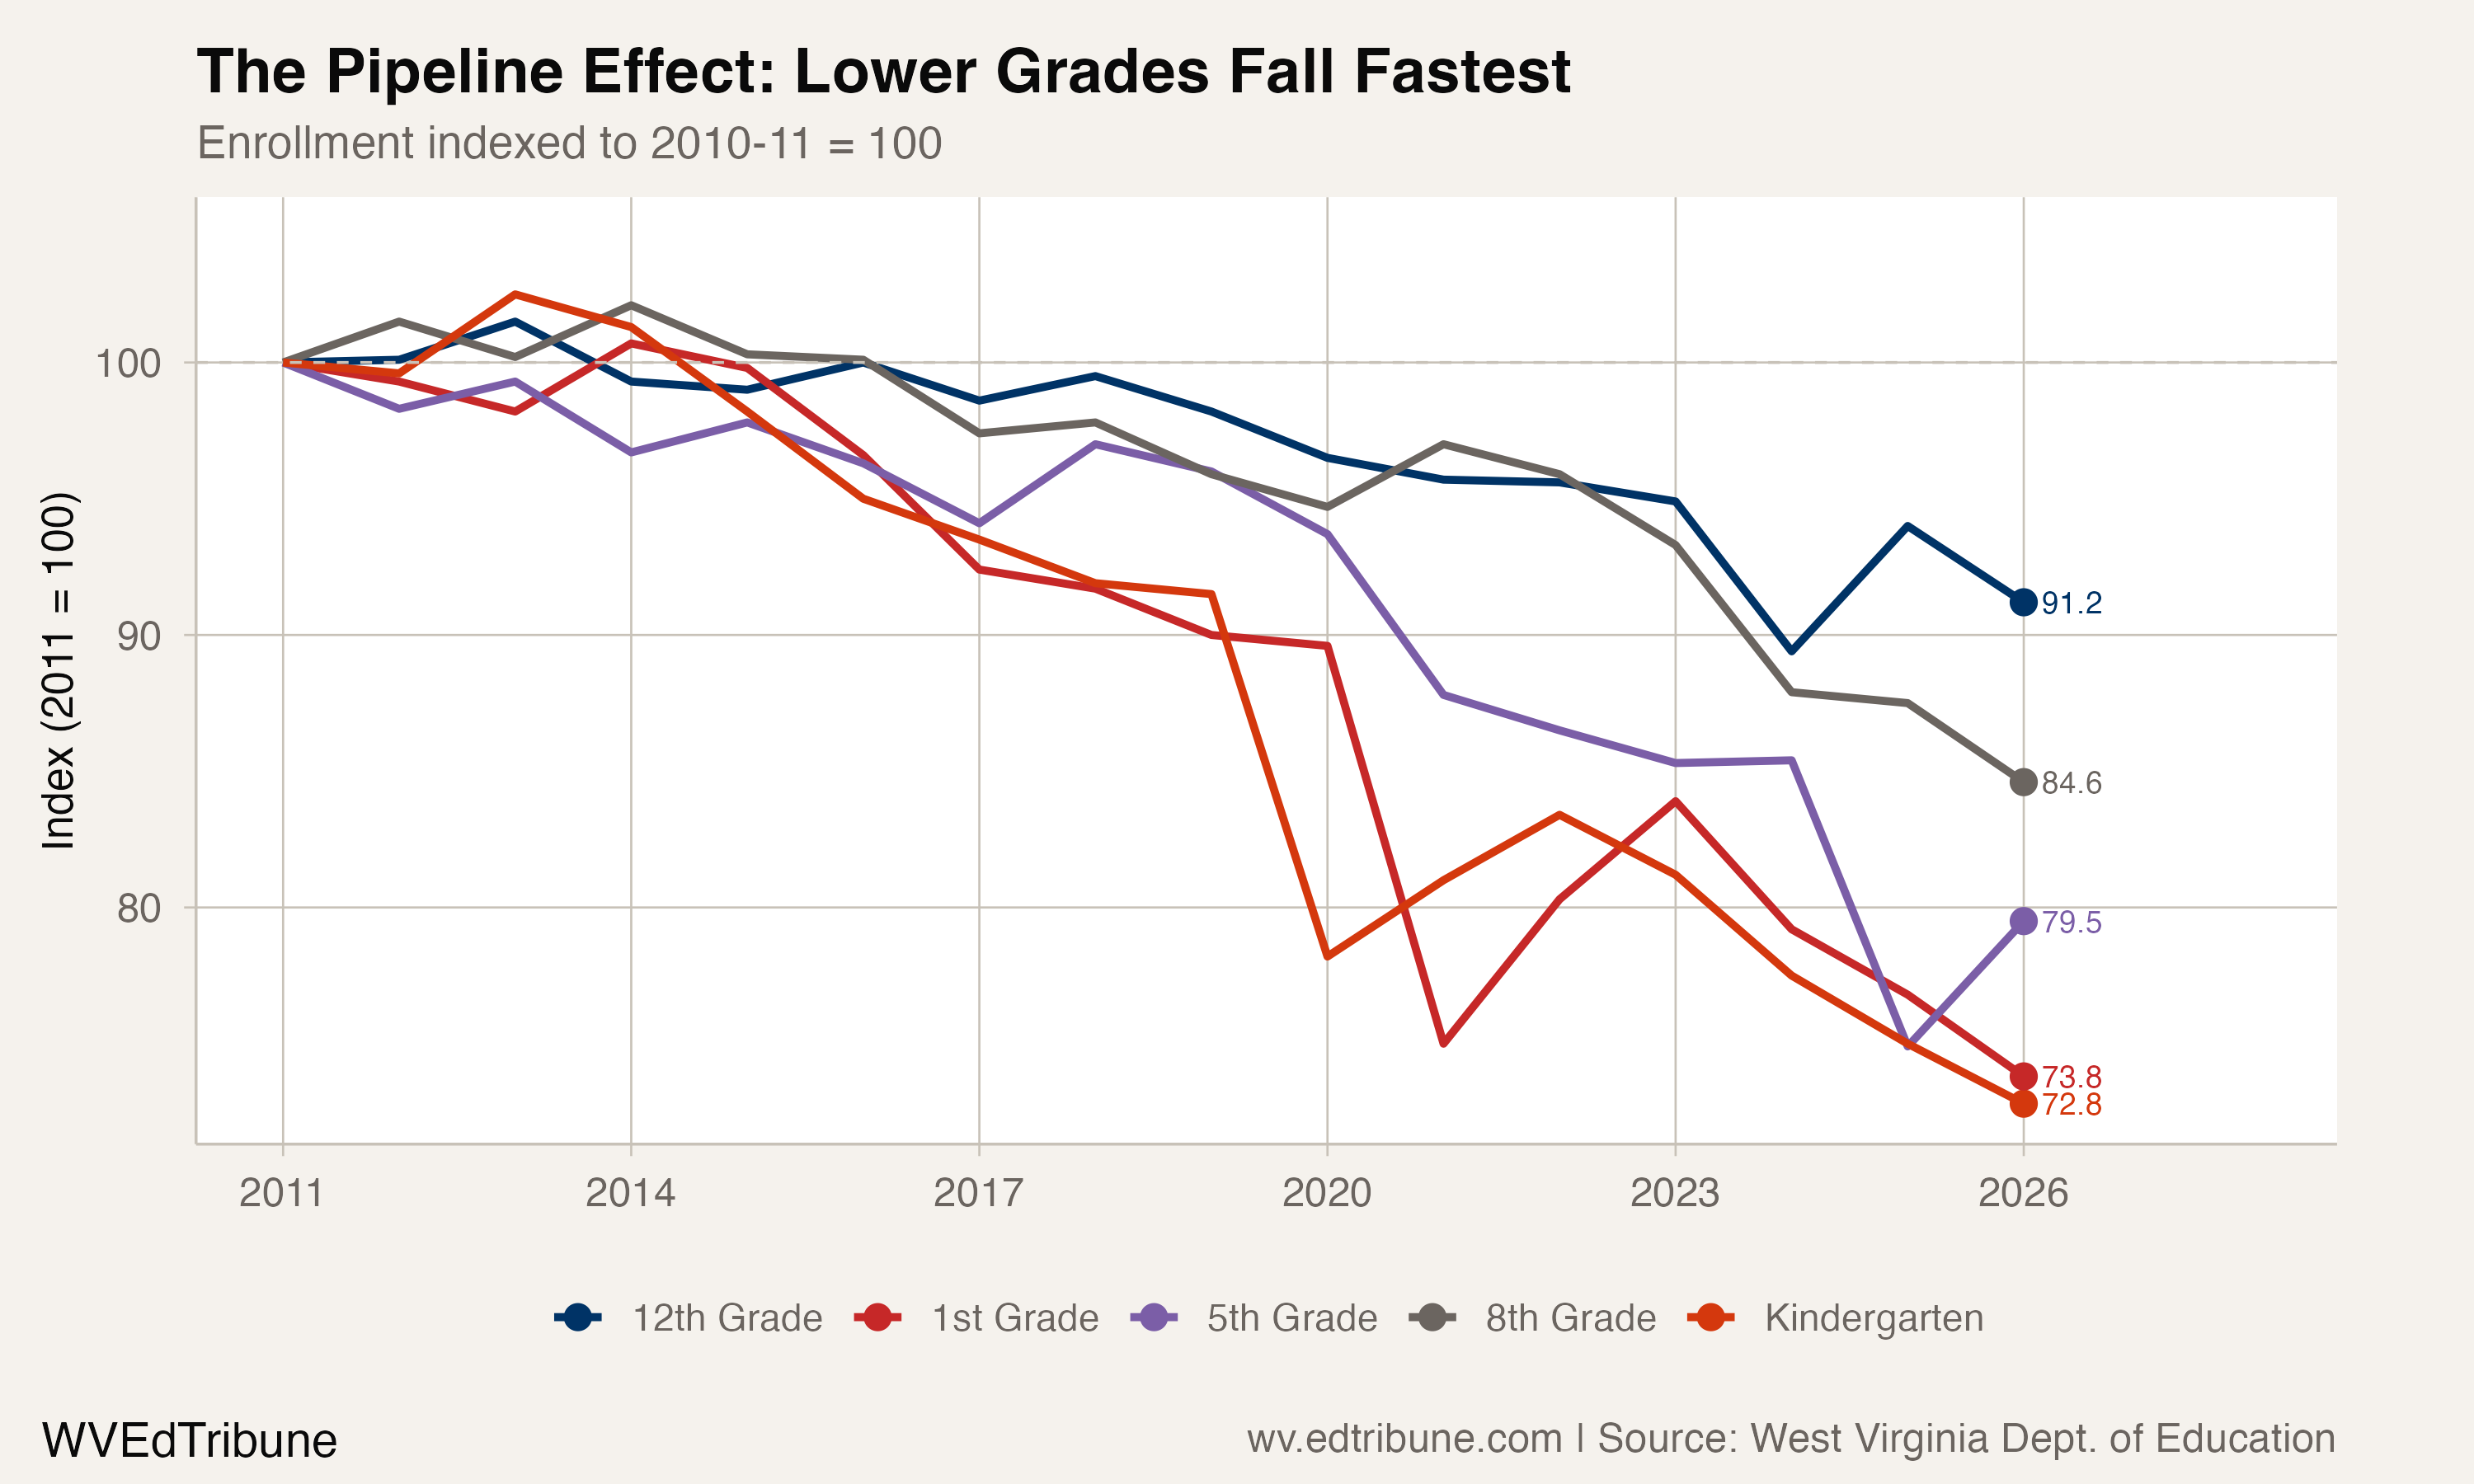
The lower grades have fallen furthest
Indexed to each grade's 2011 enrollment, kindergarten stood at 74.3 in 2026. First grade stood at 75.2, fifth grade at 80.9, eighth grade at 86.8 and grade 12 at 93.7.
The index makes the shape of the panel visible: the lower-grade counts have lost more relative ground than the upper-grade counts. It is a descriptive comparison, not a prediction about the path of an individual student.
Elementary enrollment is a smaller share of K-12
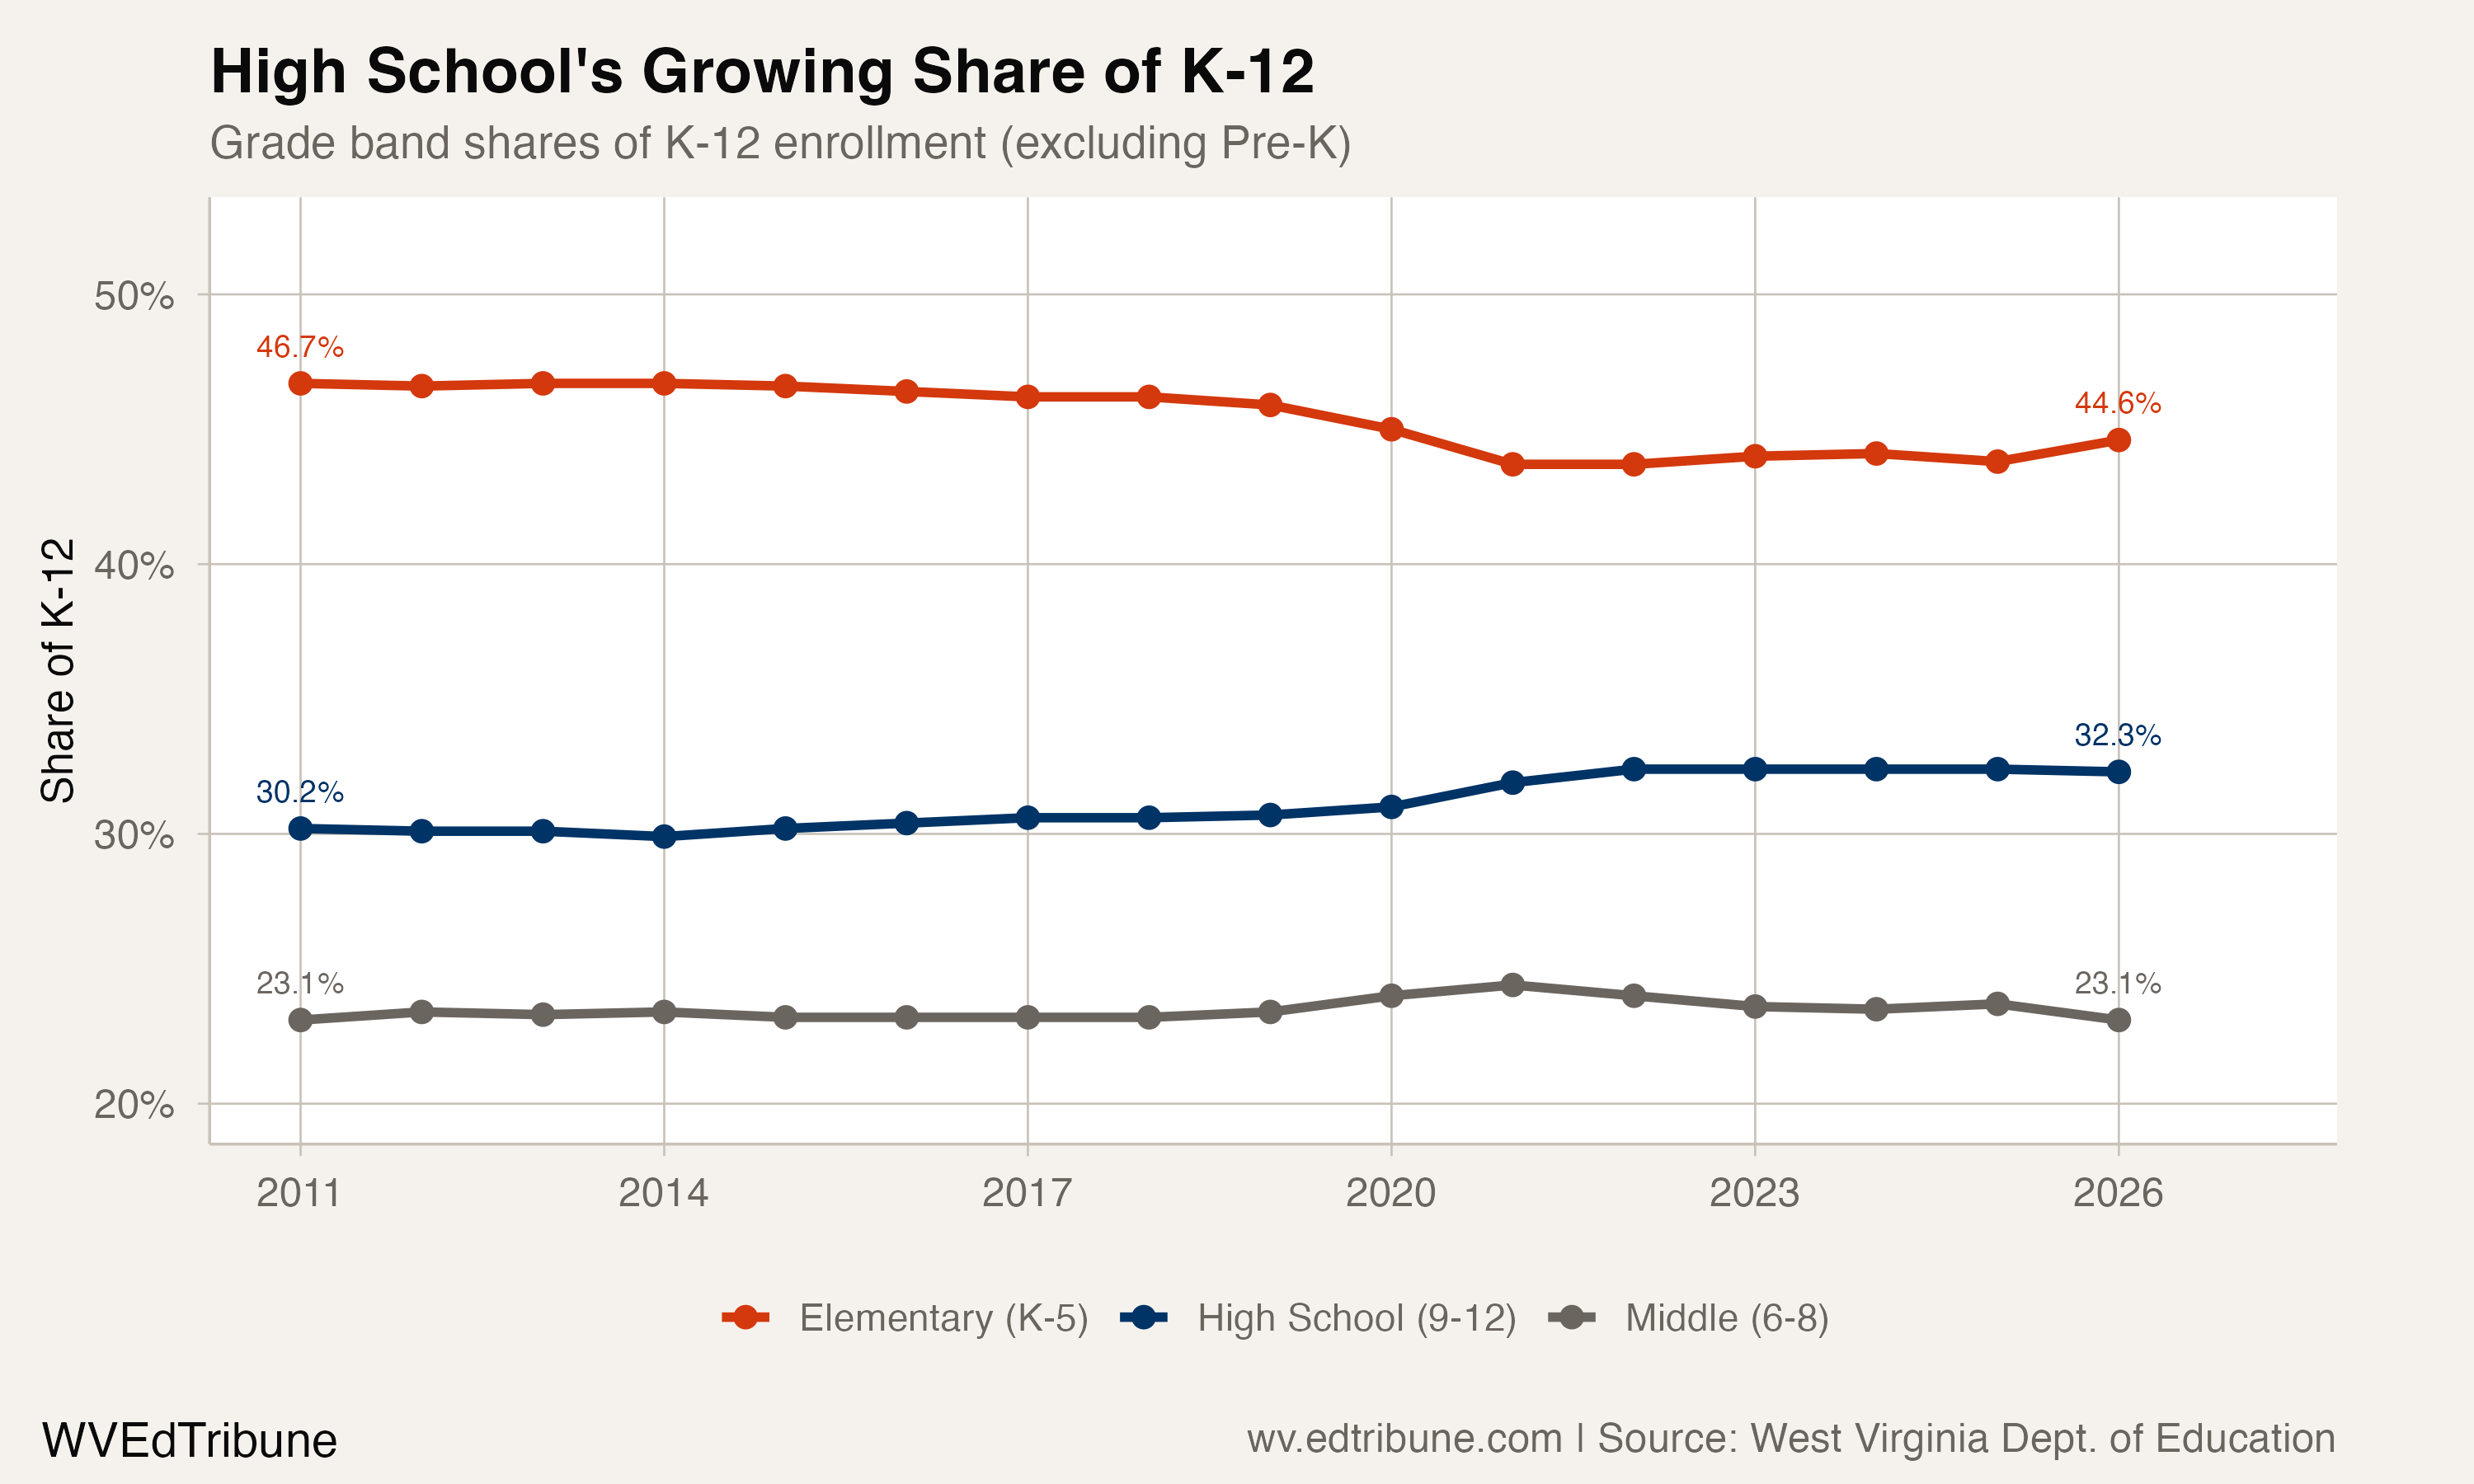
Using the published K-12 denominator—the published state total minus the published pre-K row—elementary enrollment (K-5) represented 46.7% of K-12 enrollment in 2011 and 44.4% in 2026. Middle school (grades 6-8) represented 23.1% in both years. High school (grades 9-12) rose from 30.2% to 32.5%.
The shares are composition measures. They do not show that students moved from one grade band to another, and they do not identify the operational response for a school or county system.
Small kindergarten classes are widespread
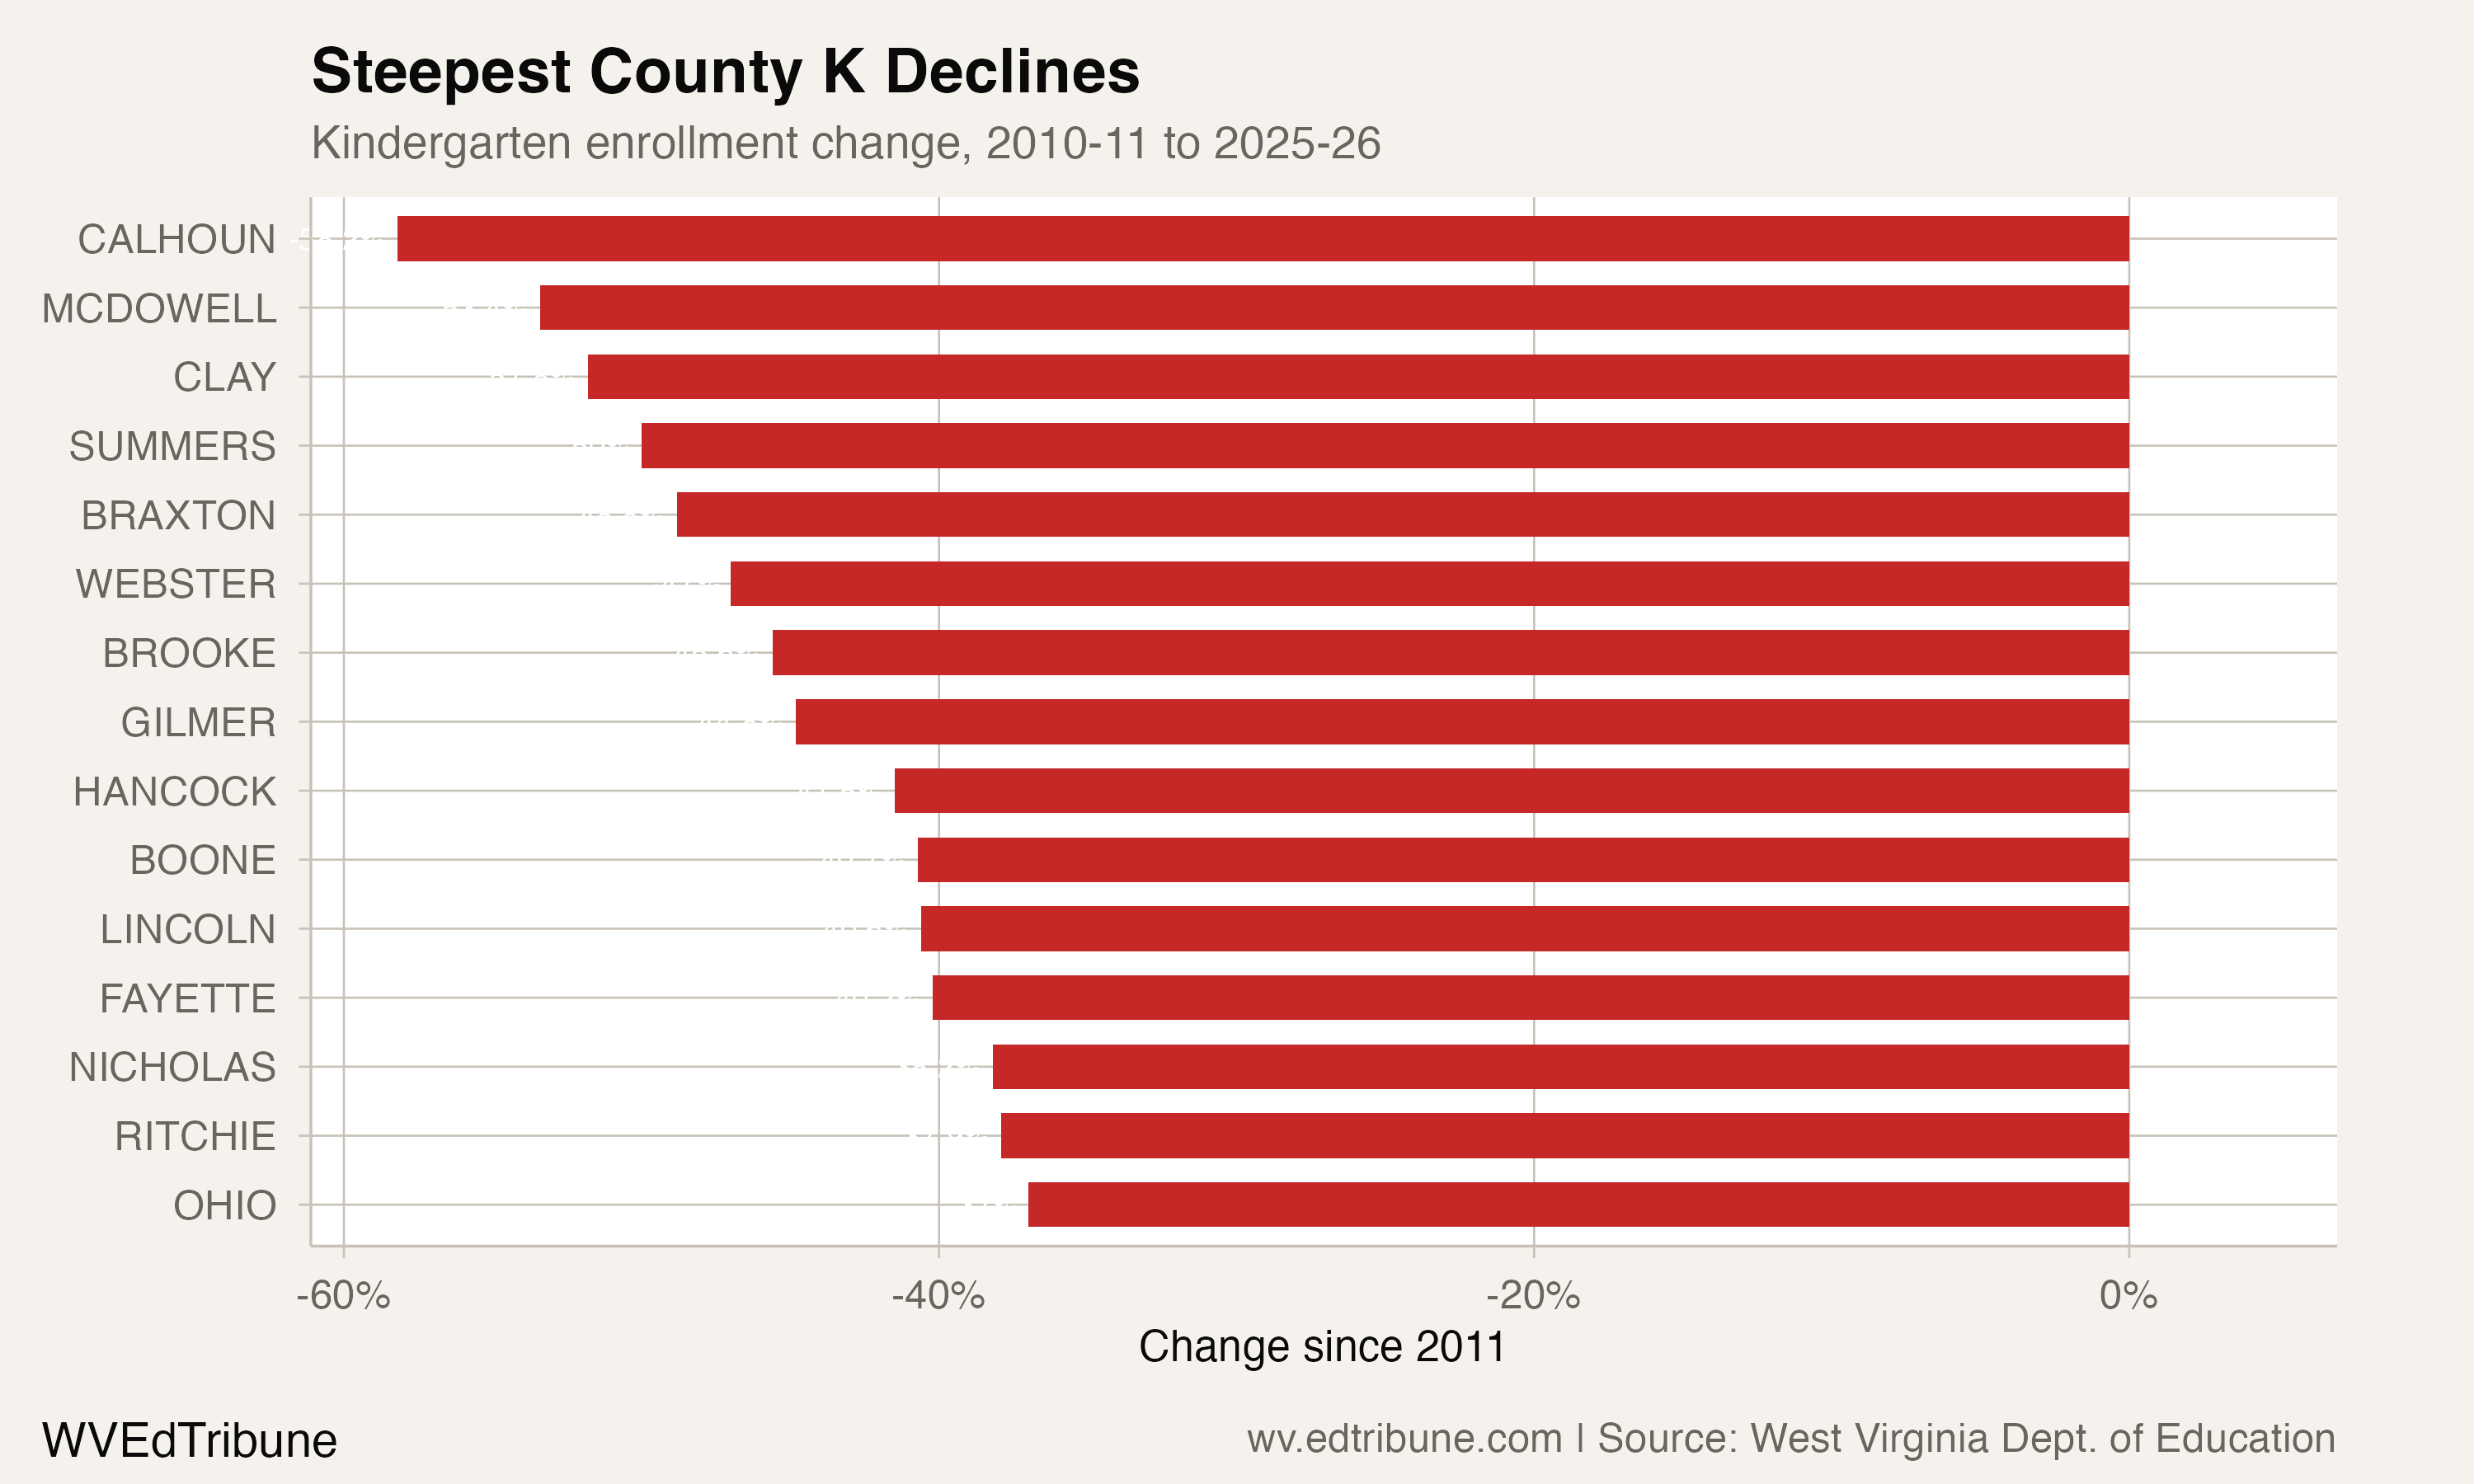
Fourteen of West Virginia's 55 county school systems enrolled fewer than 100 kindergartners in 2026. Gilmer County↗ET had 37.
Calhoun County↗ET fell from 98 kindergartners in 2011 to 43 in 2026, a 56.1% decline. McDowell County↗ET fell 53.4%, Clay County↗ET fell 51.8% and Summers County↗ET fell 50.0%.
The larger systems show the same range of scale. Kanawha County↗ET fell from 2,086 kindergartners to 1,442, a loss of 644 students or 30.9%. Berkeley County↗ET changed from 1,389 to 1,367, a decline of 1.6%.
One descriptive bulge in the grade panel
The published grade counts also show a recurring difference between the same-year eighth- and ninth-grade totals. The ninth-grade count was 110.2% of the eighth-grade count in 2026; the largest ratio in the 2011-2026 panel was 116.7%.
That comparison cannot determine why the counts differ. Grade repetition, transfers and reporting or classification changes are competing explanations; the panel does not provide a causal decomposition.
What the data can support
The direct evidence is a smaller kindergarten count, a larger relative decline in several lower grades than in grade 12, a reversal in the same-year K/12 comparison, and wide variation across county systems.
Demographic change and movement between public schools and other education sectors are possible context, but this panel cannot apportion them. The U.S. Census Bureau's population estimates provide demographic context. The West Virginia Treasury's Hope Scholarship information documents a school-choice policy context. Neither source turns this descriptive enrollment series into a causal estimate.
For district leaders, the grade and county comparisons are a planning signal about the size and distribution of current classes. They are not a forecast of a particular graduating class, and they do not by themselves determine staffing, facilities or school-configuration decisions.
Enrollment counts come from the West Virginia Department of Education's 2025-26 enrollment data.
Detailed code that reproduces the analysis and figures in this article is available exclusively to EdTribune subscribers.
Discussion
Sign in to join the discussion.
Loading comments...