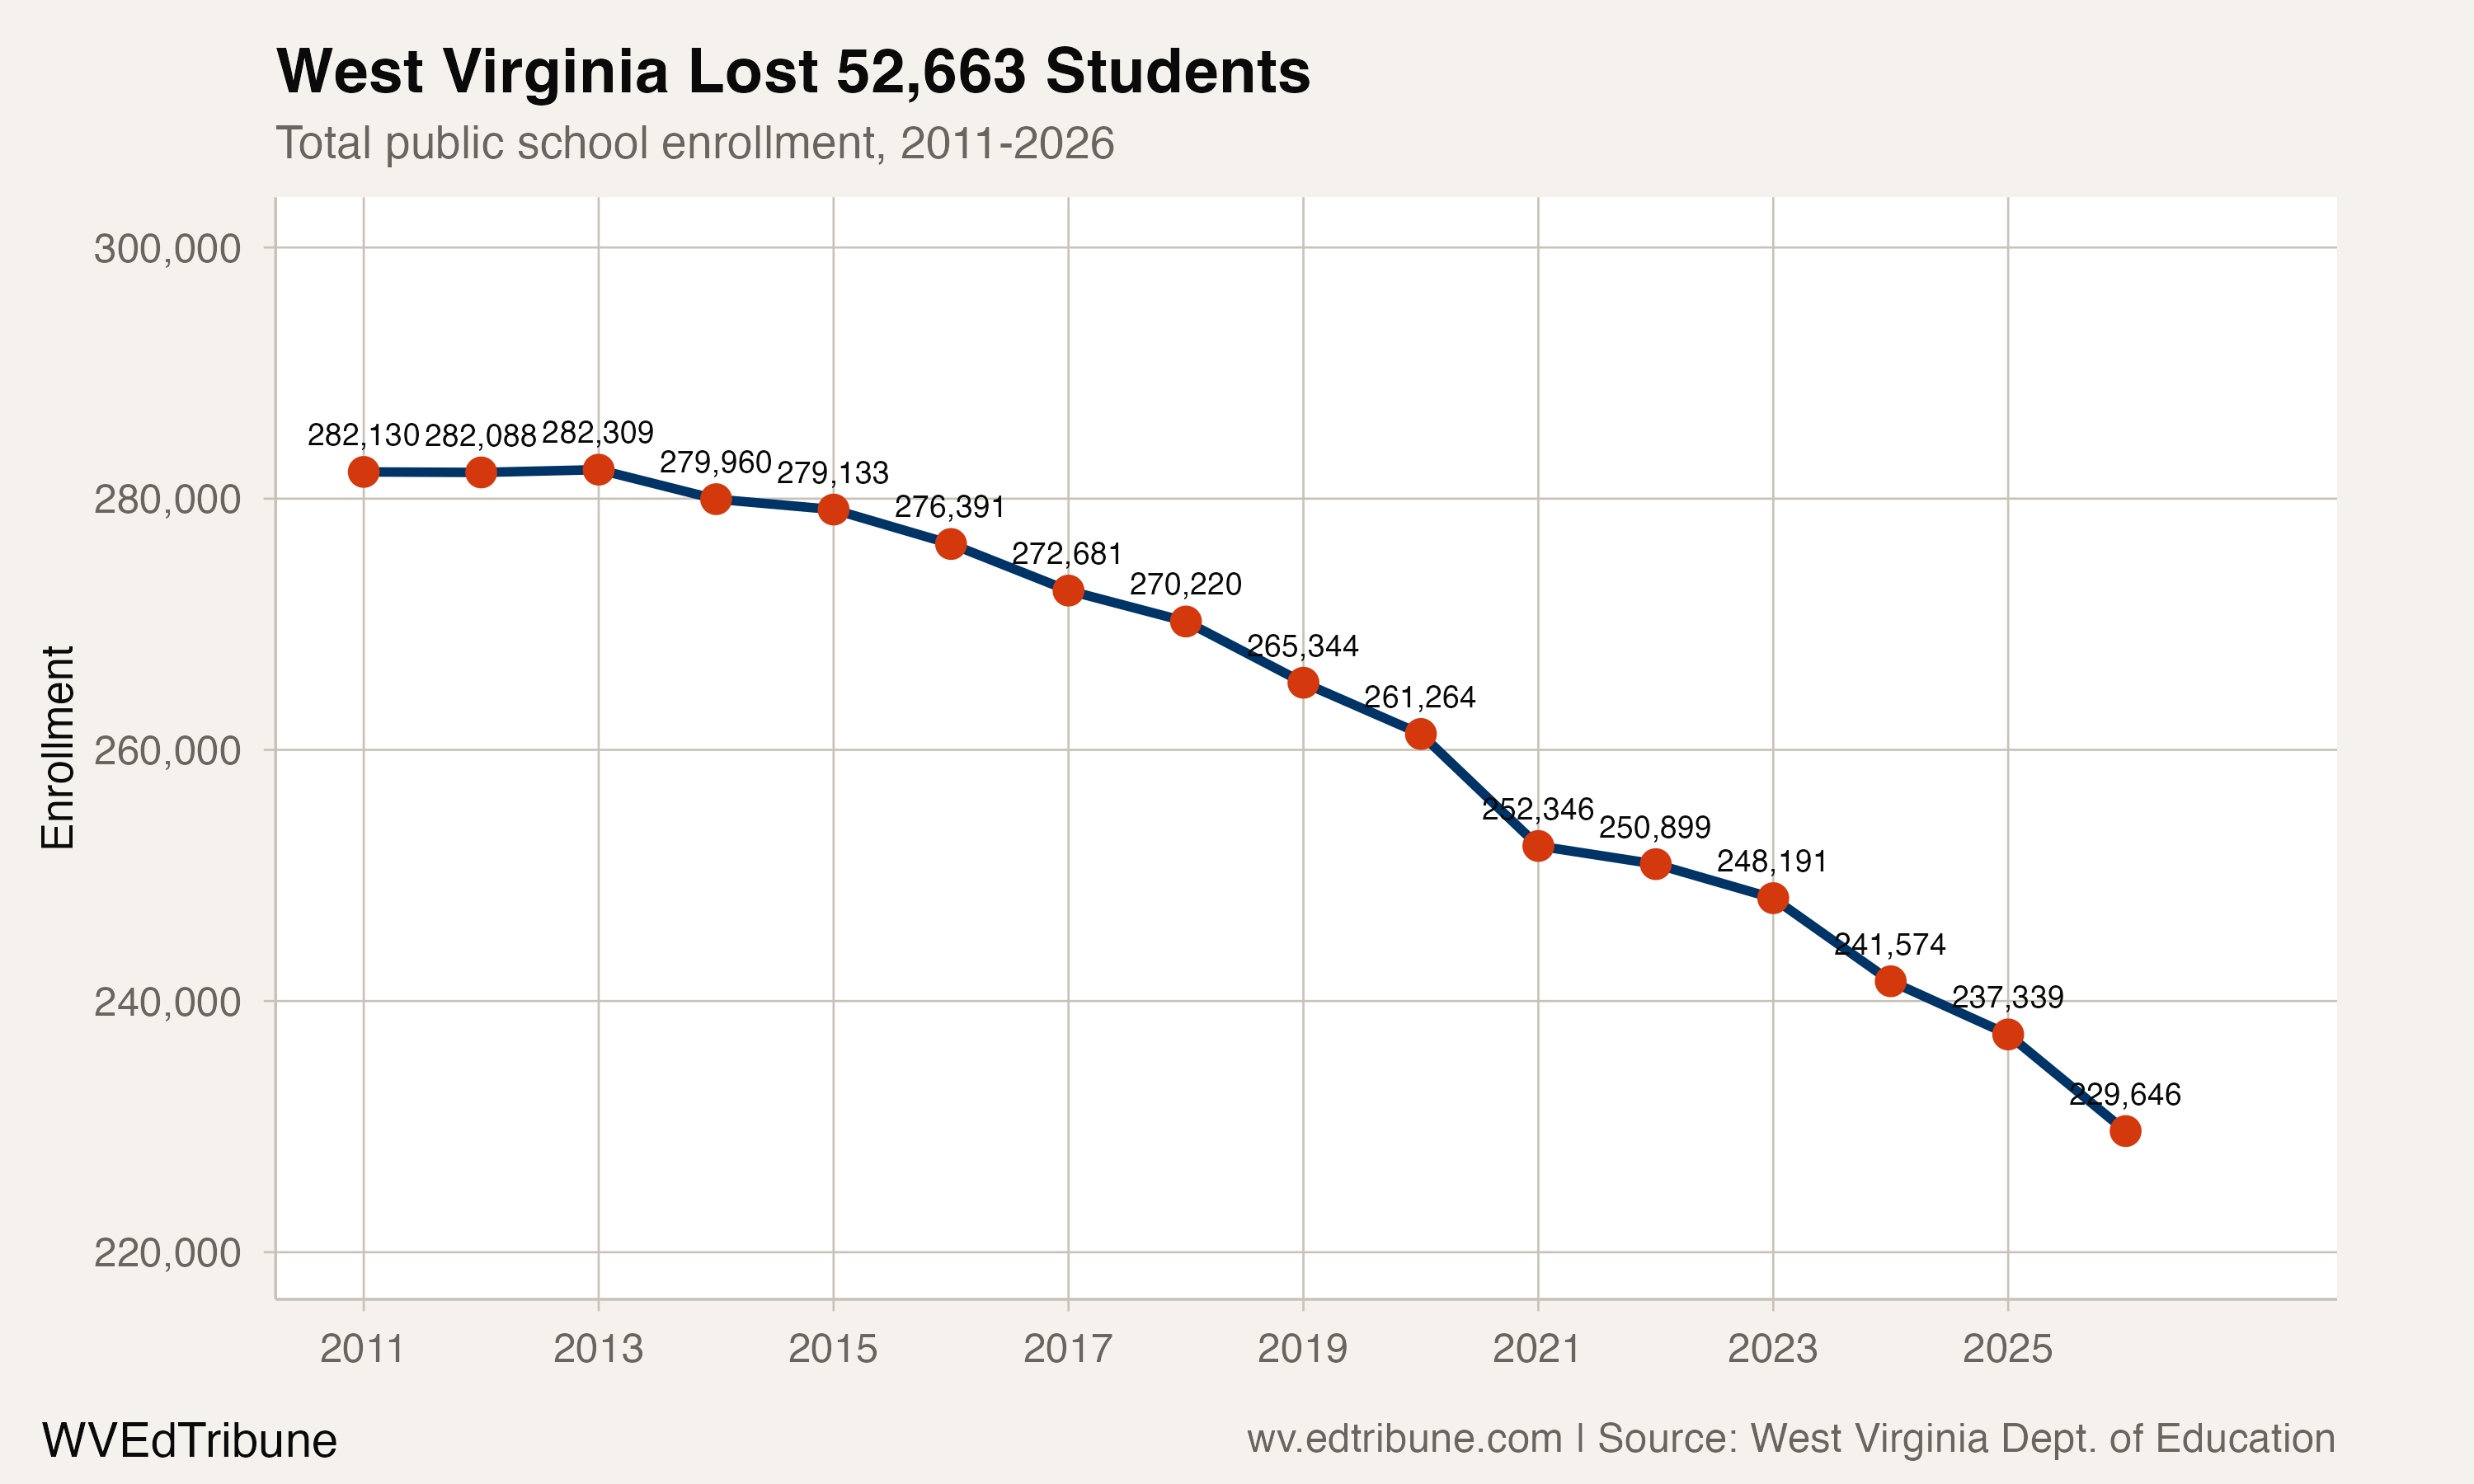
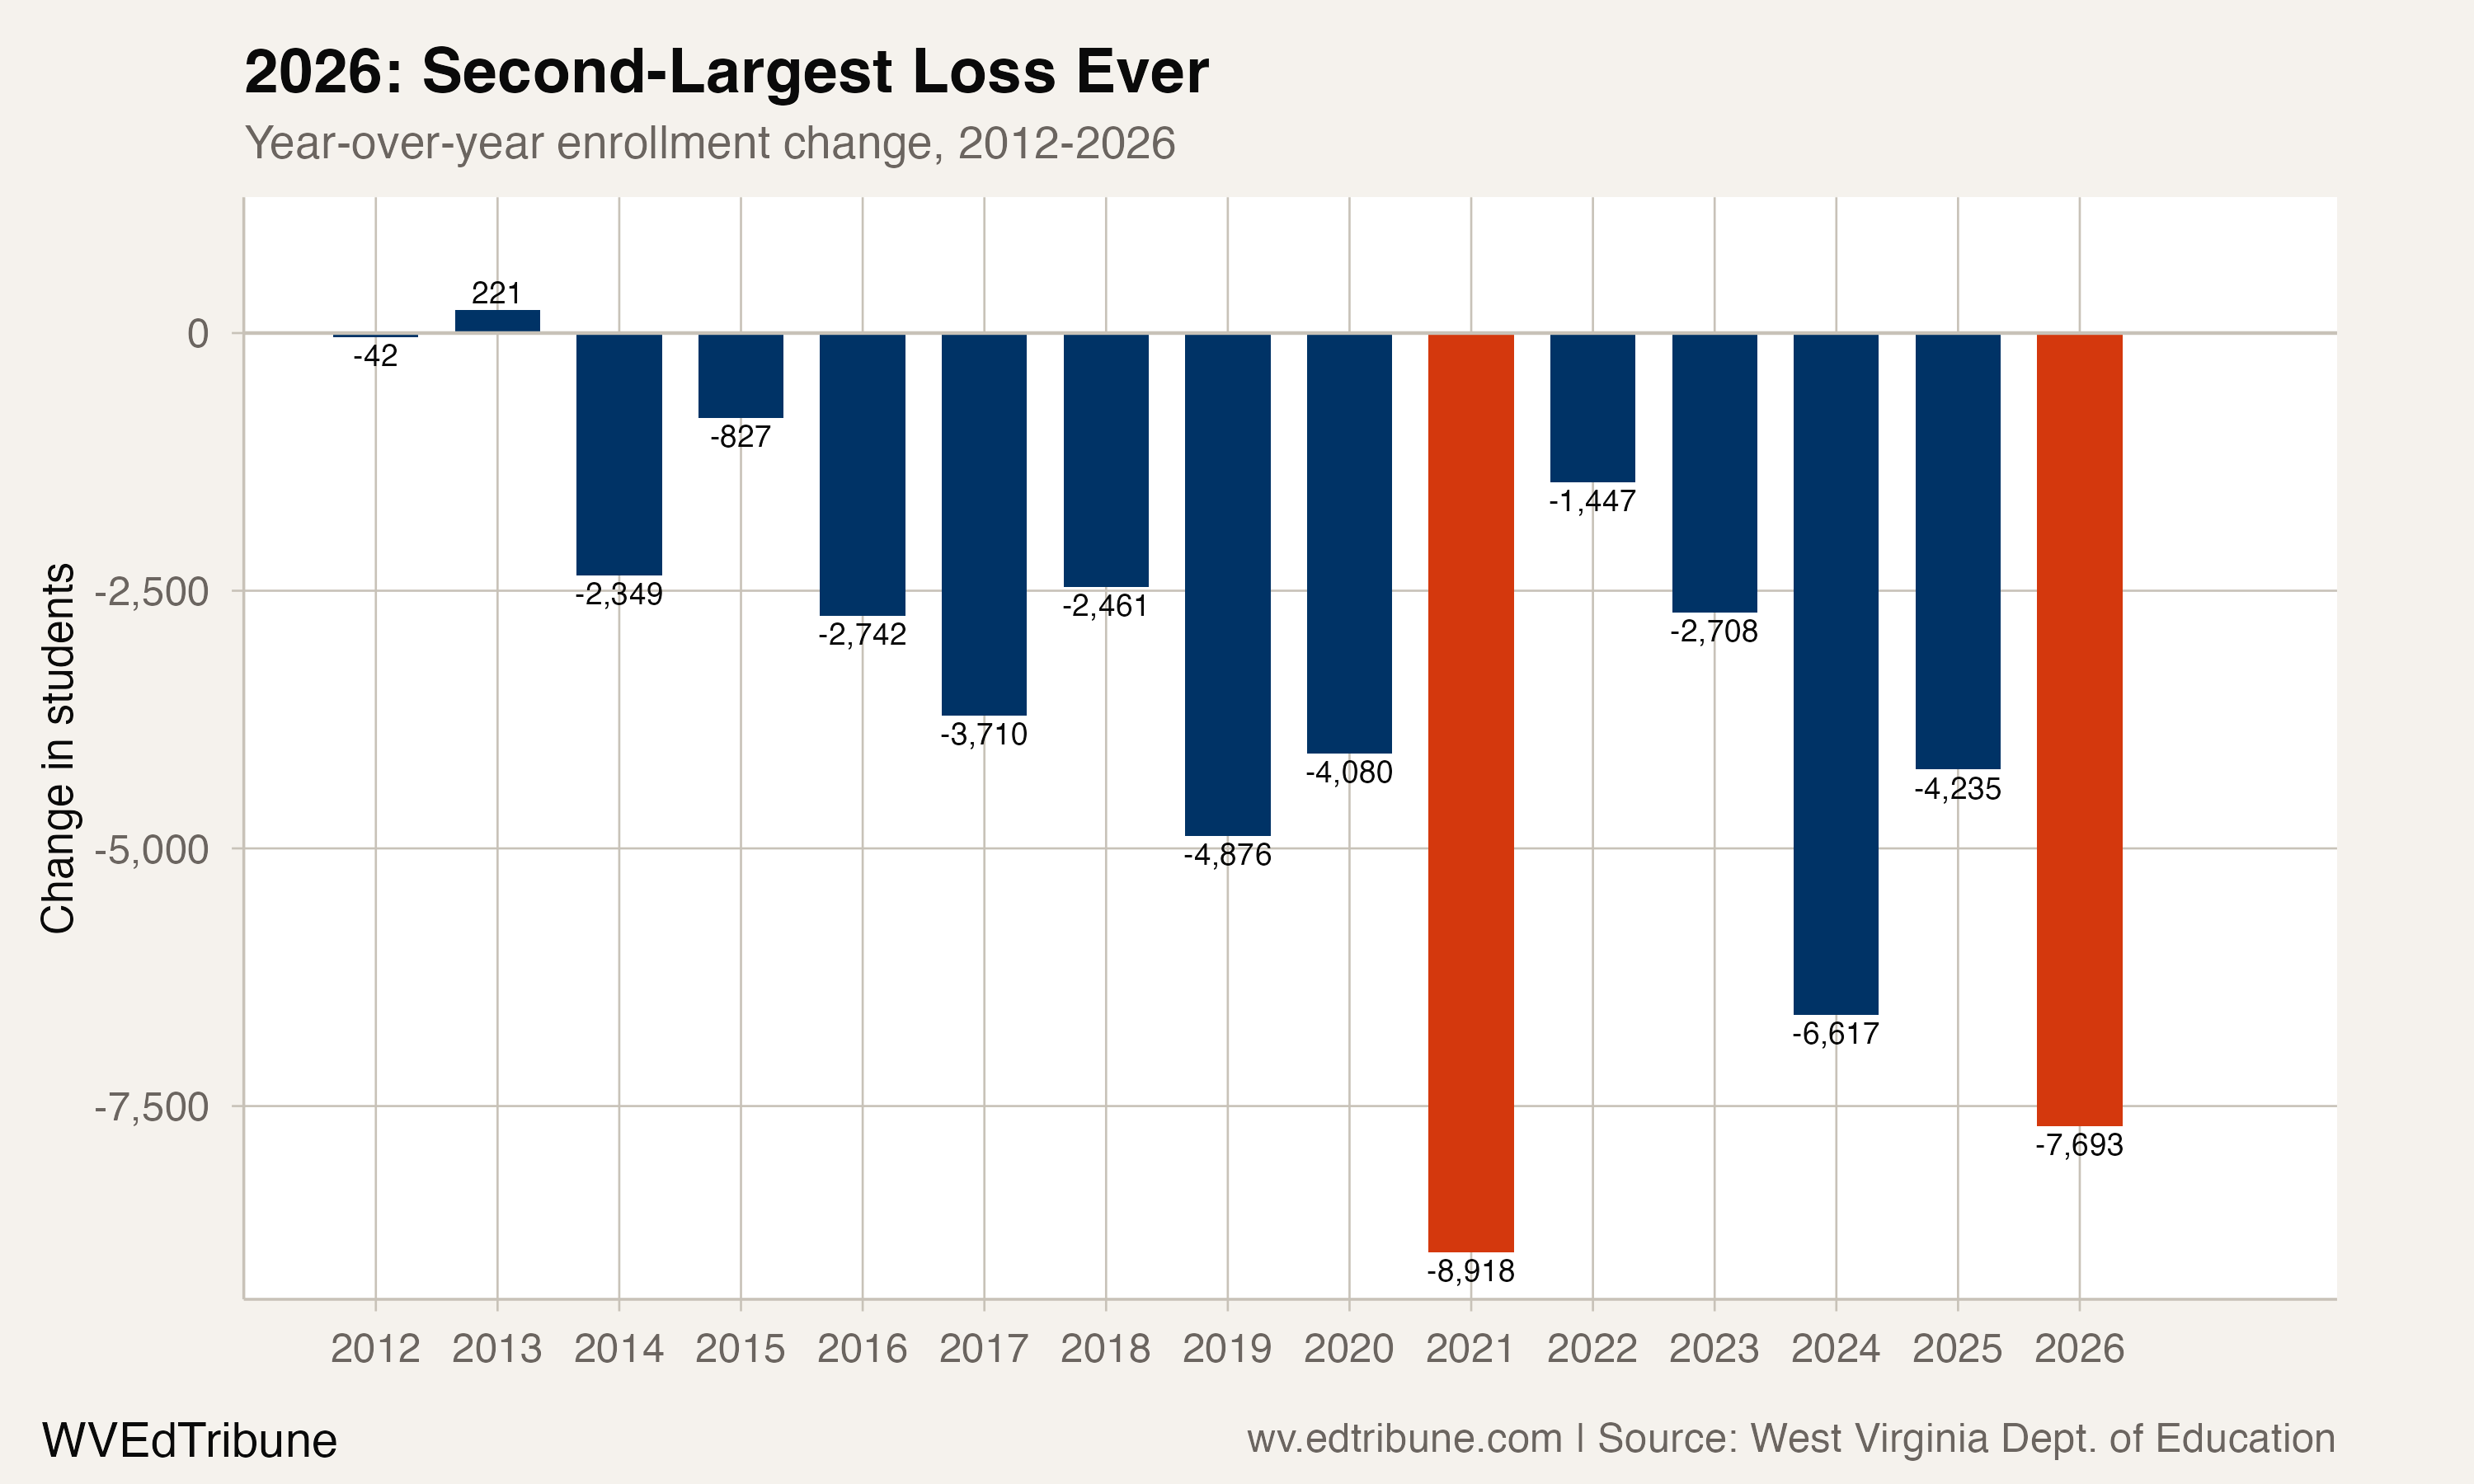
The current West Virginia enrollment panel shows 234,957 public school students in 2025-26, down 6,067 from 2024-25 — a 2.5% decline. The 2021 loss was larger, at 9,276 students; the 2025-26 loss is the largest outside that pandemic-year shock and the second-largest loss in the 2011-2026 panel. The state is at a new low for the series.
Thirteen years without growth
West Virginia recorded one year of growth after its 2011 starting point: enrollment rose by 221 students in 2012-13 and peaked at 282,309. Enrollment then declined for 13 consecutive years. The state has lost 47,352 students from that peak, a 16.8% decline.
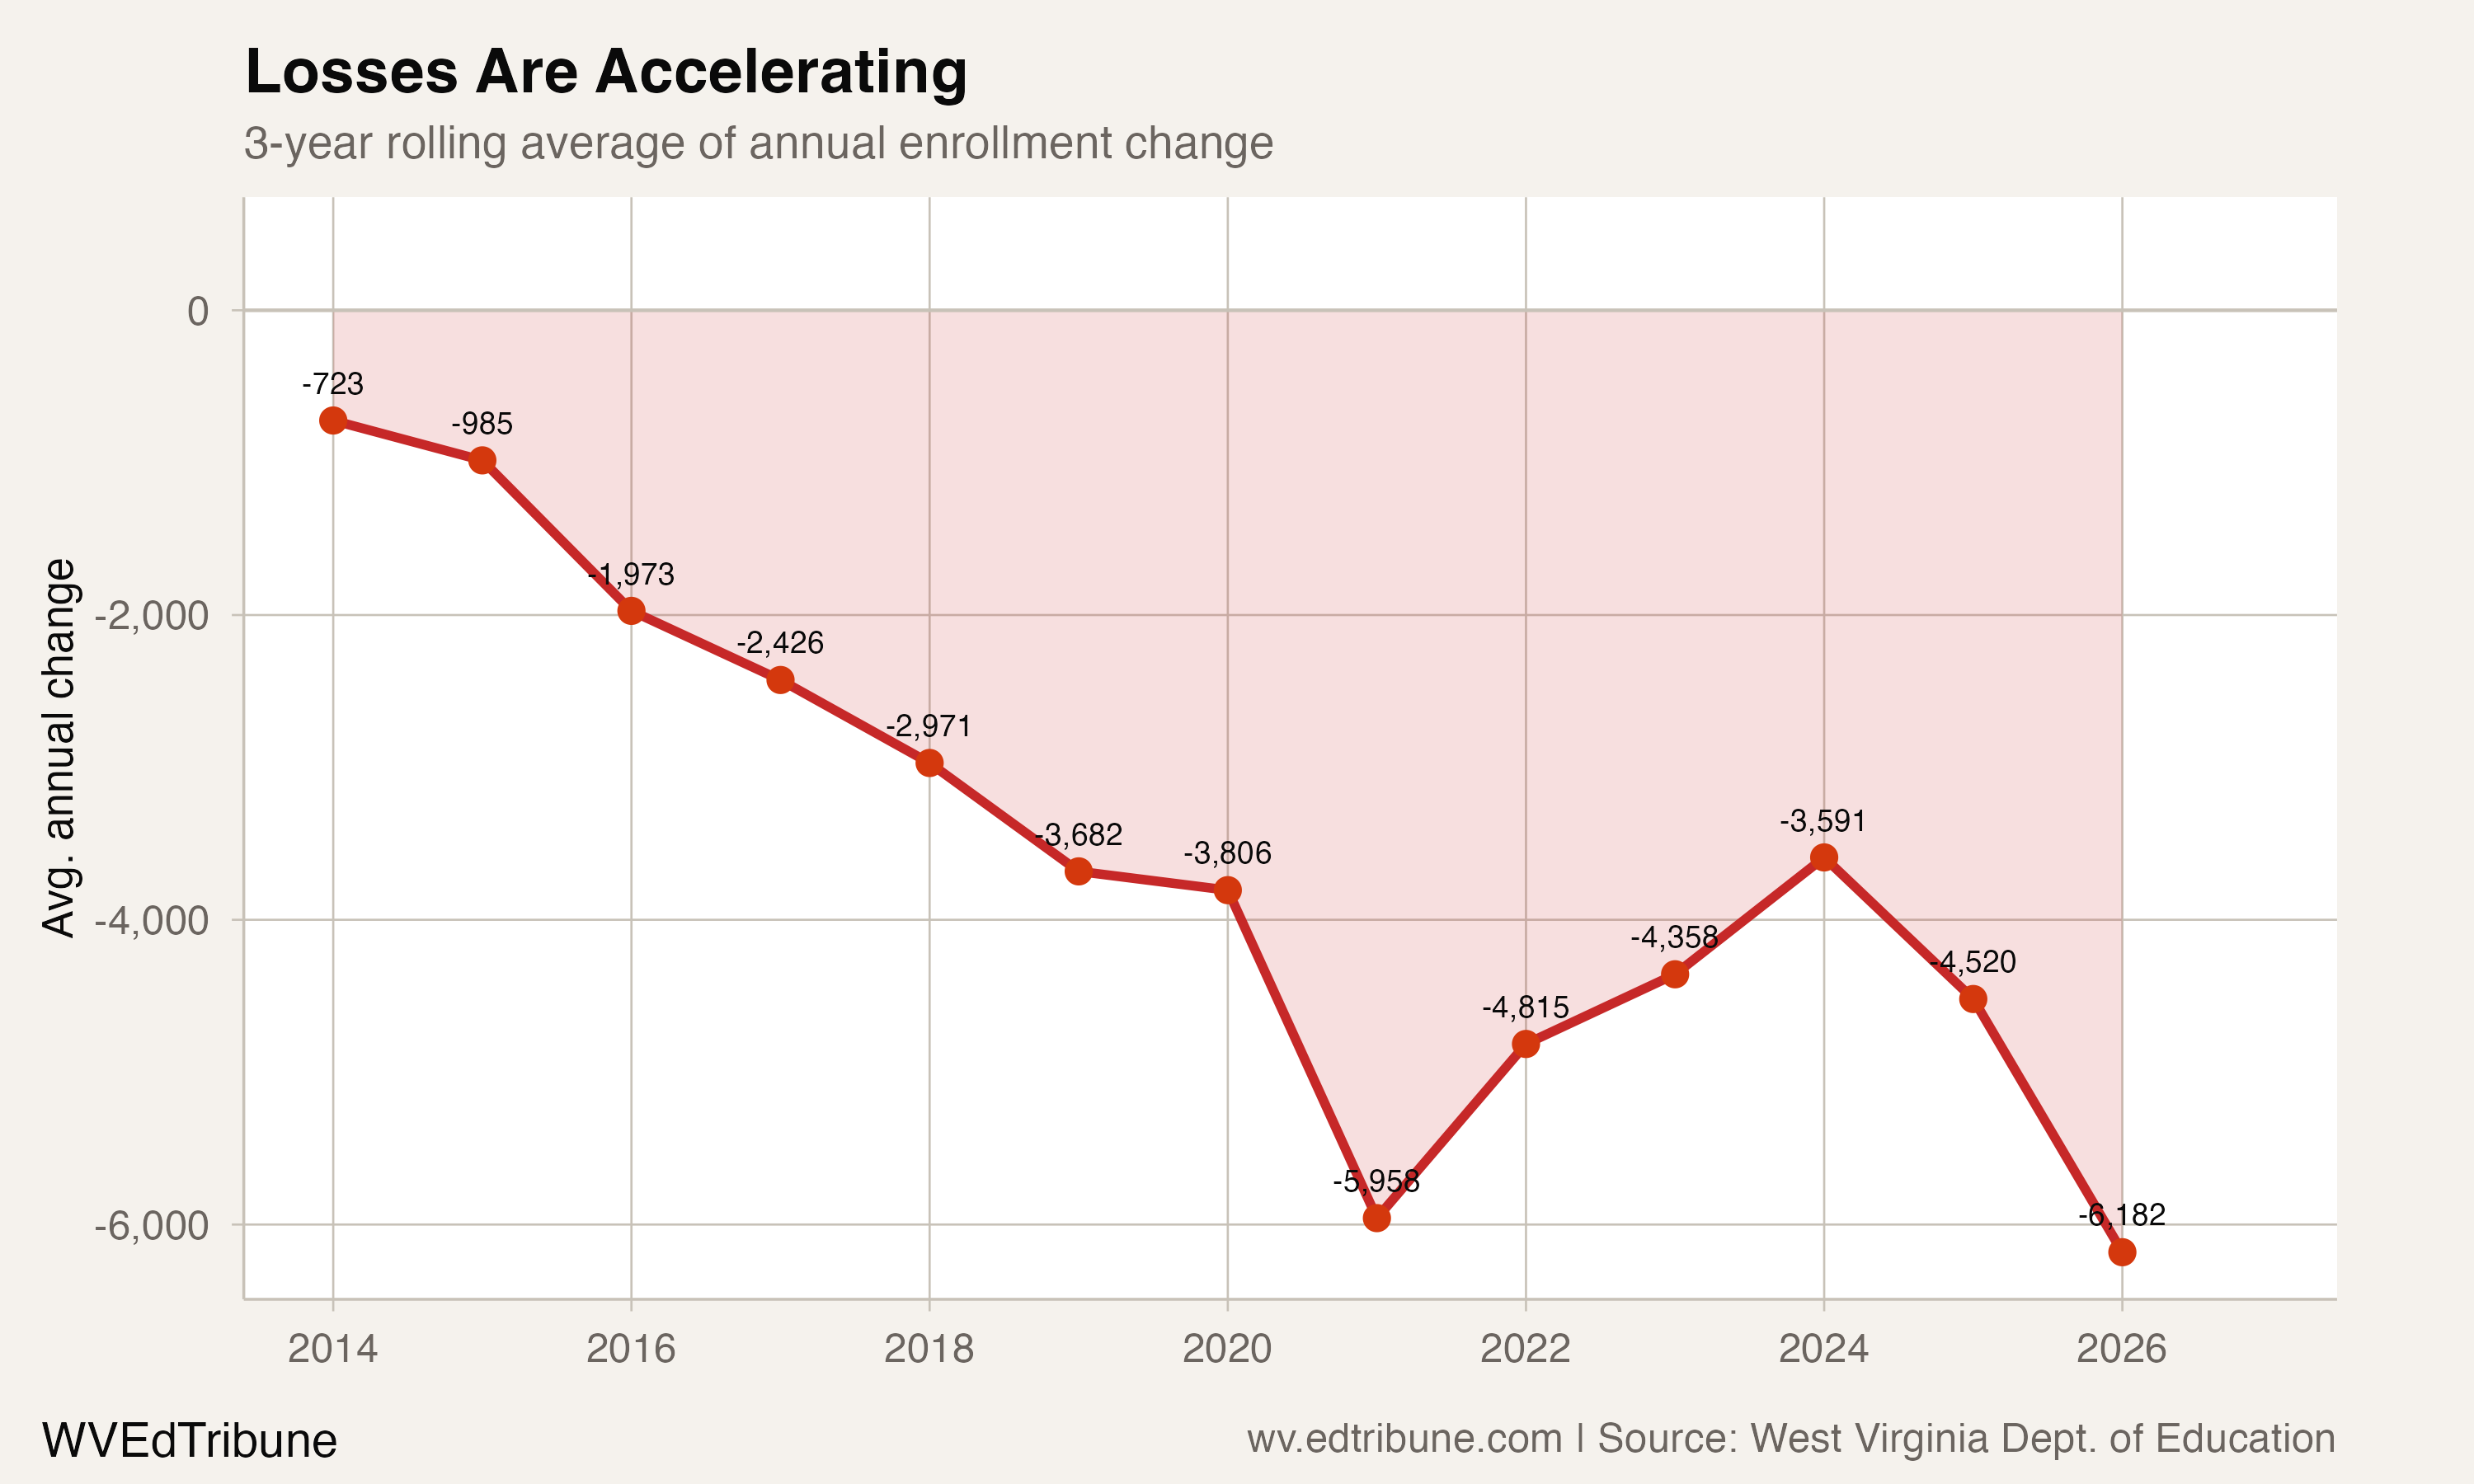
The pace has varied by period. The average year-over-year change was -999 students from 2012 through 2016, -3,794 from 2017 through 2019, -4,952 during 2020-2022, and -3,986 during 2023-2026. The recent period remains substantially steeper than the early years of the decline, even though its average is below the pandemic-era window that includes 2021.
The three-year rolling average of annual change was -5,031 in 2026.
51 of 55 counties lost students
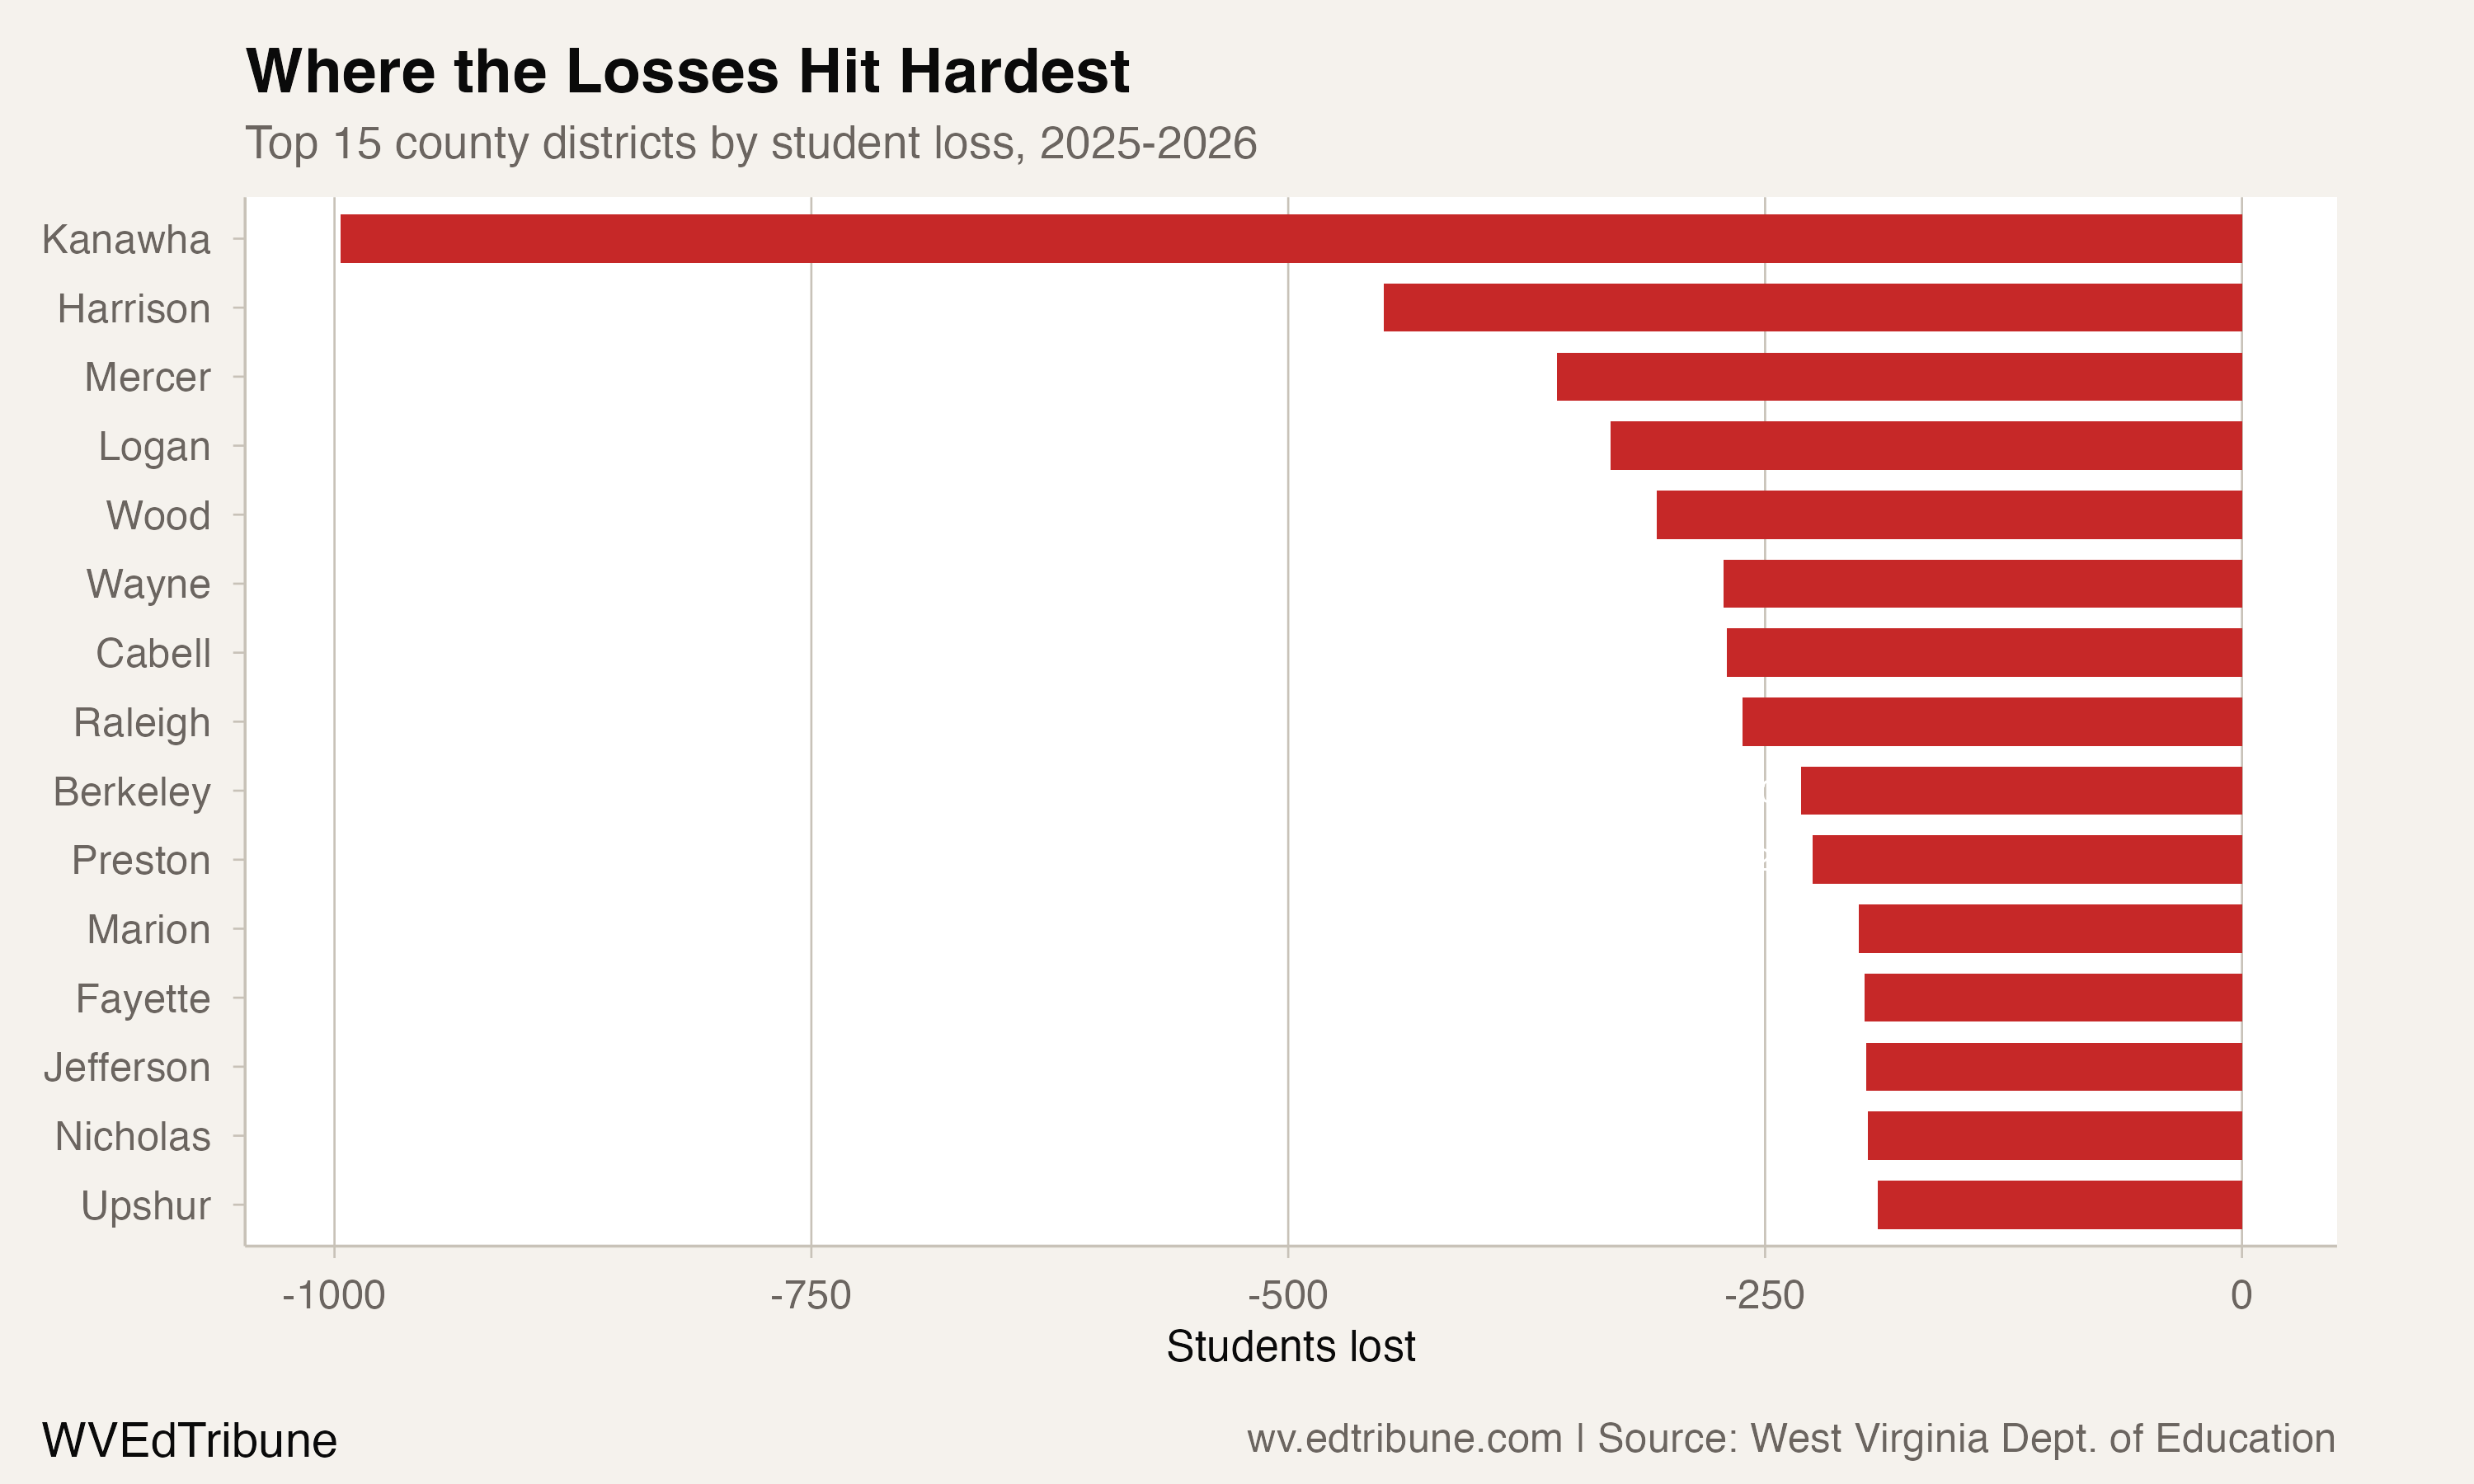
The 2026 losses were widespread. Fifty-one of the state's 55 county school systems lost enrollment. Four gained: Mineral County↗ET rose by 3 students, Hampshire↗ET by 14, Doddridge↗ET by 17, and Tyler↗ET by 40.
Kanawha↗ET County, the state's largest district, lost 969 students in a single year, a 4.2% decline that brought it to 22,132, down from 28,458 in 2011. That is a loss of 6,326 students over 15 years. Harrison↗ET County lost 429 students, or 4.6%. Logan↗ET County lost 318, or 6.8%.
Forty-eight of 55 counties are now at their all-time enrollment low. Seven systems sit above their historical floors: Berkeley↗ET, Doddridge, Hampshire, Hardy↗ET, Mineral, Monongalia↗ET and Tyler.
Over the past three years, 54 of 55 counties lost students, for a statewide net decline of 18,087 students.
Three forces, no easy fix
Suggestive context — demographic pressure. The enrollment panel shows the outcome but cannot identify why an individual student is no longer enrolled. Population research from USAFacts and the West Virginia Center on Budget and Policy describes natural decrease and out-migration as persistent state-level pressures. Those sources provide context, not a causal decomposition of this enrollment change.
Suggestive context — school choice. The West Virginia State Treasurer's Office and regional reporting describe the Hope Scholarship's expansion. The enrollment panel cannot distinguish a student who left the state from one who moved to private school or home education; both appear as public-enrollment losses.
Direct evidence — the grade pipeline. Kindergarten enrollment fell 27.5% from 21,776 in 2013 to 15,781 in 2026. Grade 12 enrollment fell 7.7%, from 18,616 to 17,187. The K-to-12 ratio moved from 117 students per 100 seniors in 2013 to 91.8 in 2026. In the current snapshot, the graduating cohort is 1,406 students larger than the incoming kindergarten cohort.
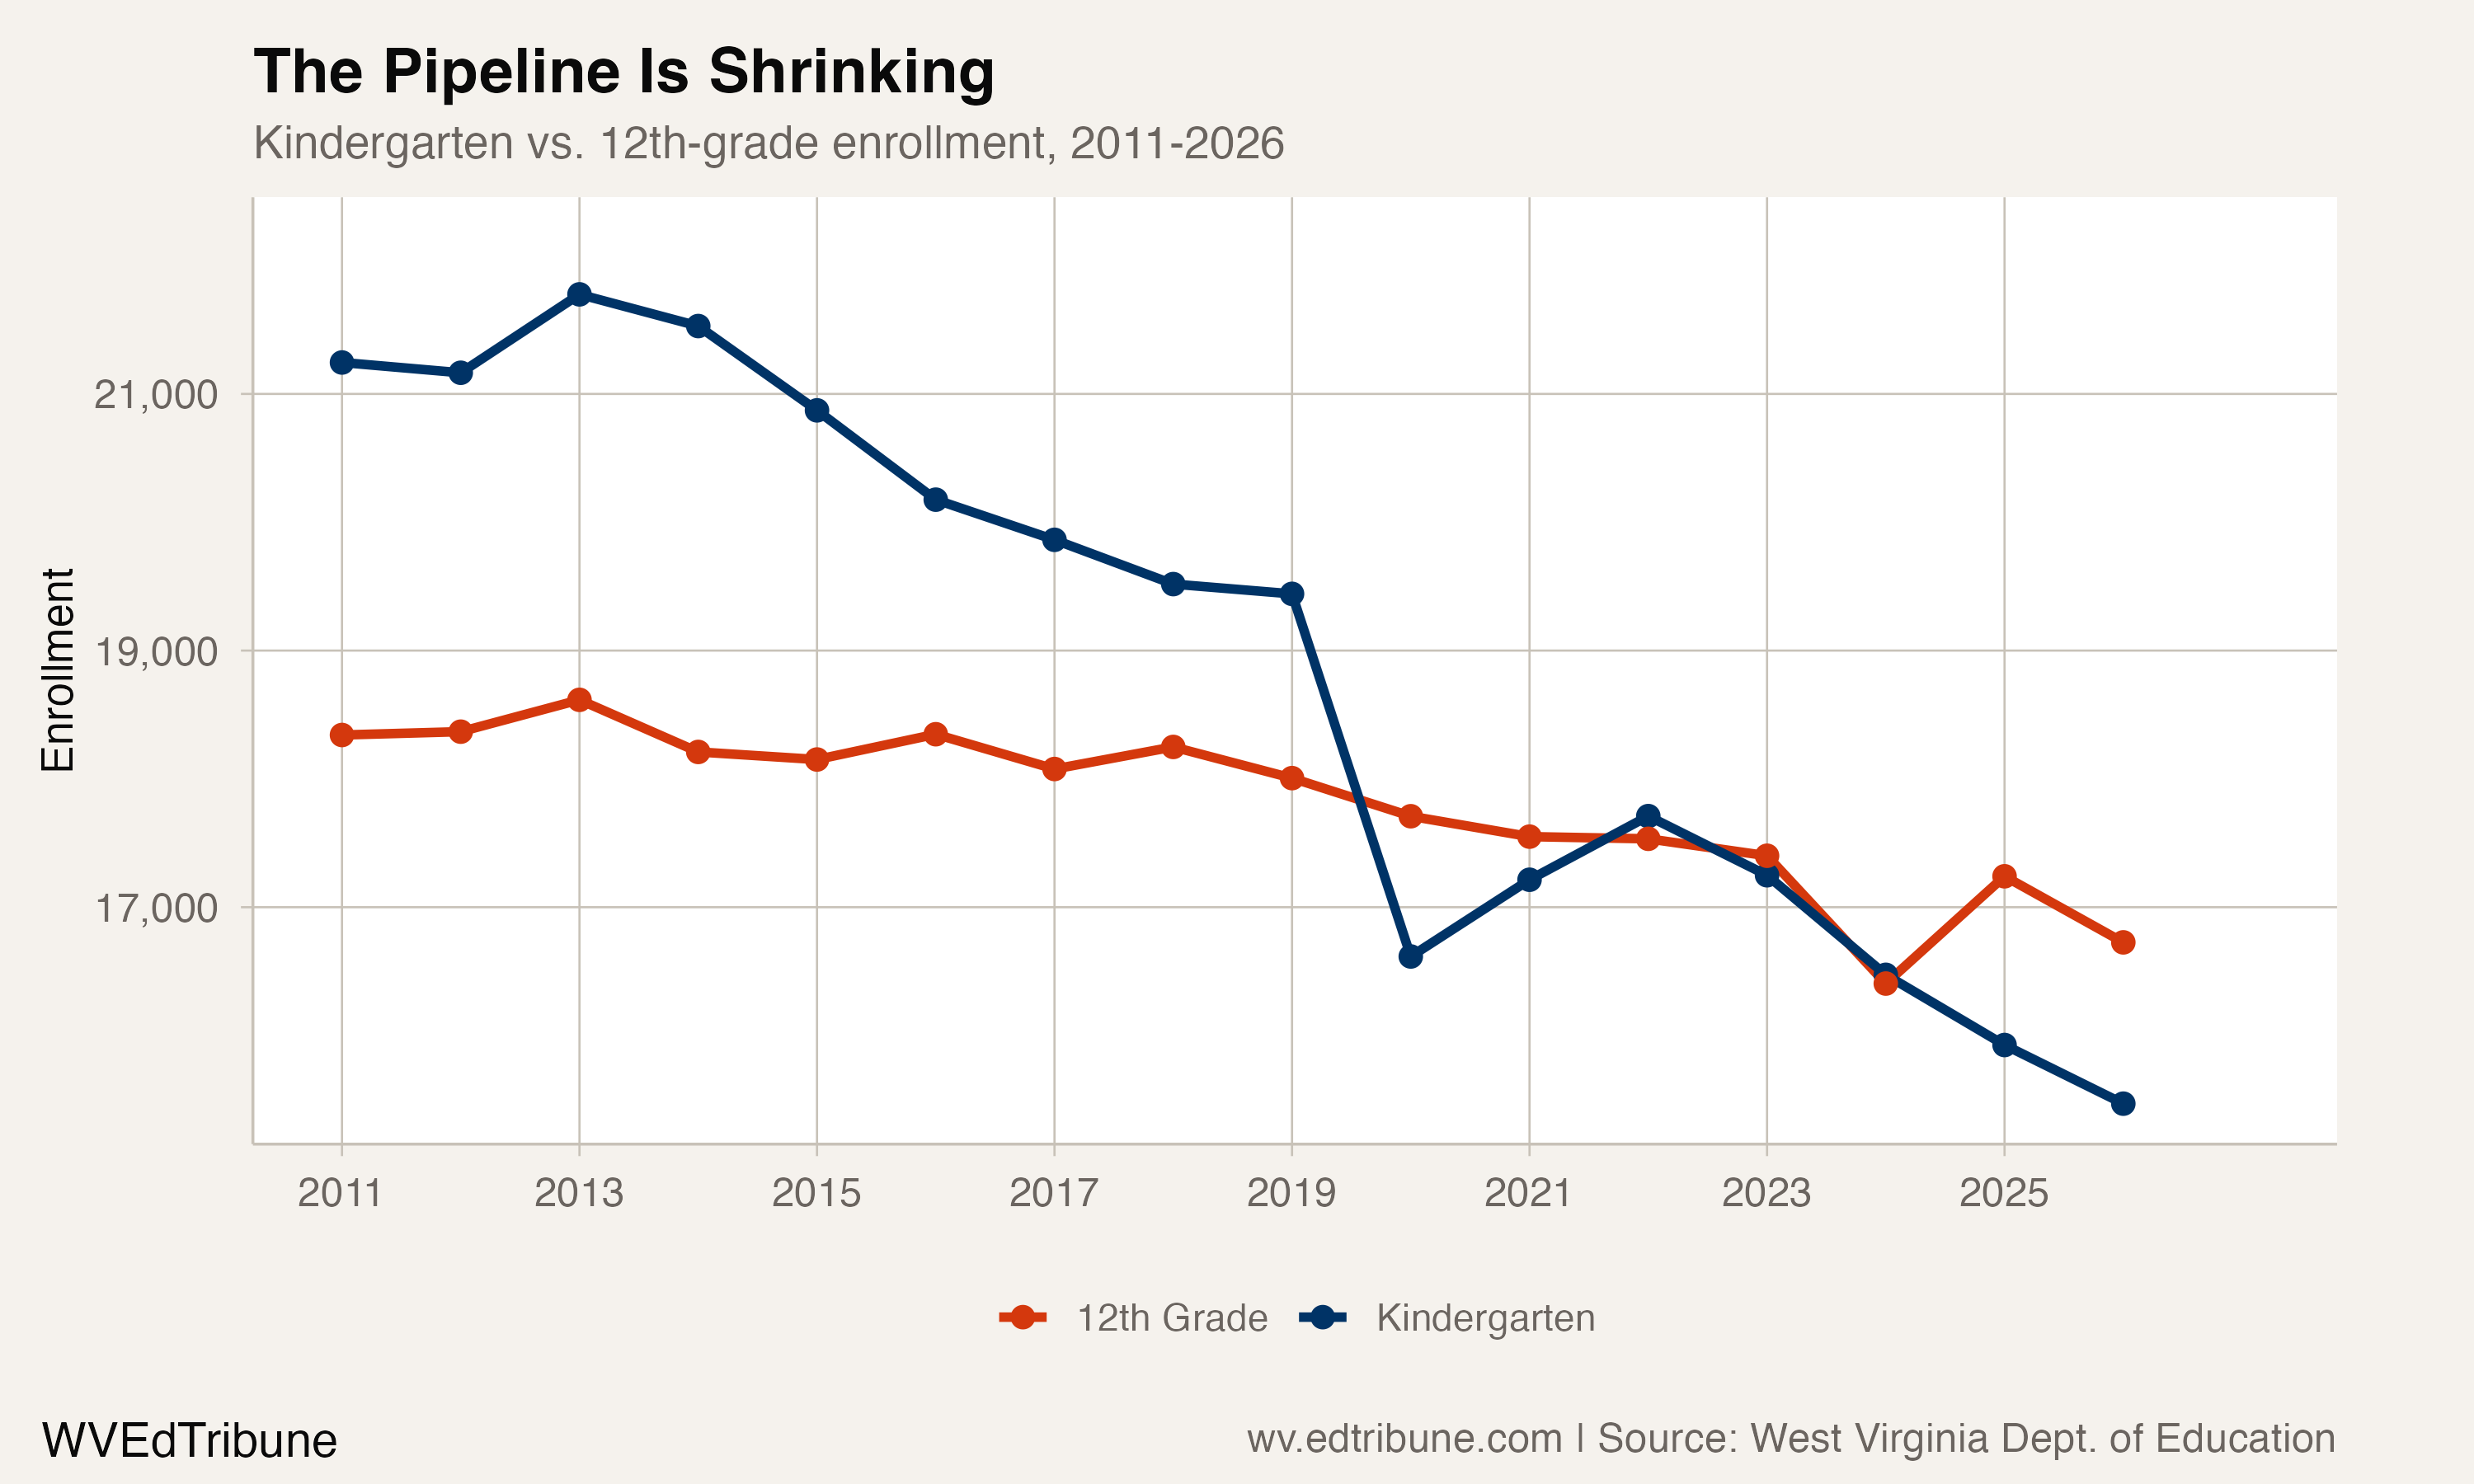
The pipeline is a direct warning about replacement pressure, not a forecast of a specific future enrollment total. The package data supports the imbalance; it cannot by itself separate births, migration, school choice or other causes.
What the data can and cannot establish
The enrollment data establishes the scale and distribution of the 2025-26 decline: 6,067 students statewide, 51 county systems down, and a new series low. It does not, standing alone, establish how school budgets, closures, staffing, population movement or school-choice policy contributed to that change. Those mechanisms require their own source-specific evidence.
This correction updates the figures to the current 2011-2026 package snapshot and removes unsupported external numeric projections and budget/closure counts from the prior version.
Detailed code that reproduces the analysis and figures in this article is available exclusively to EdTribune subscribers.
Discussion
Sign in to join the discussion.
Loading comments...