Correction: An earlier version used an outdated enrollment panel. This version uses the current published 2011-2026 panel and updates the statewide and county-system figures.
Three West Virginia county school systems grew between 2011 and 2026. Forty-eight of the state's 55 county systems, meanwhile, ended 2025-26 at their lowest enrollment in the full panel.
Statewide enrollment was 234,957 students in 2025-26, down 6,067 from 2024-25, a 2.5% decline. The contrast is the point: a few districts have grown, but the statewide pattern is broad and the exceptions are limited.
The exceptions are few
Doddridge County↗ET finished 2025-26 with 1,220 students, its highest enrollment in the panel. It grew by 51 students, or 4.4%, from 2011.
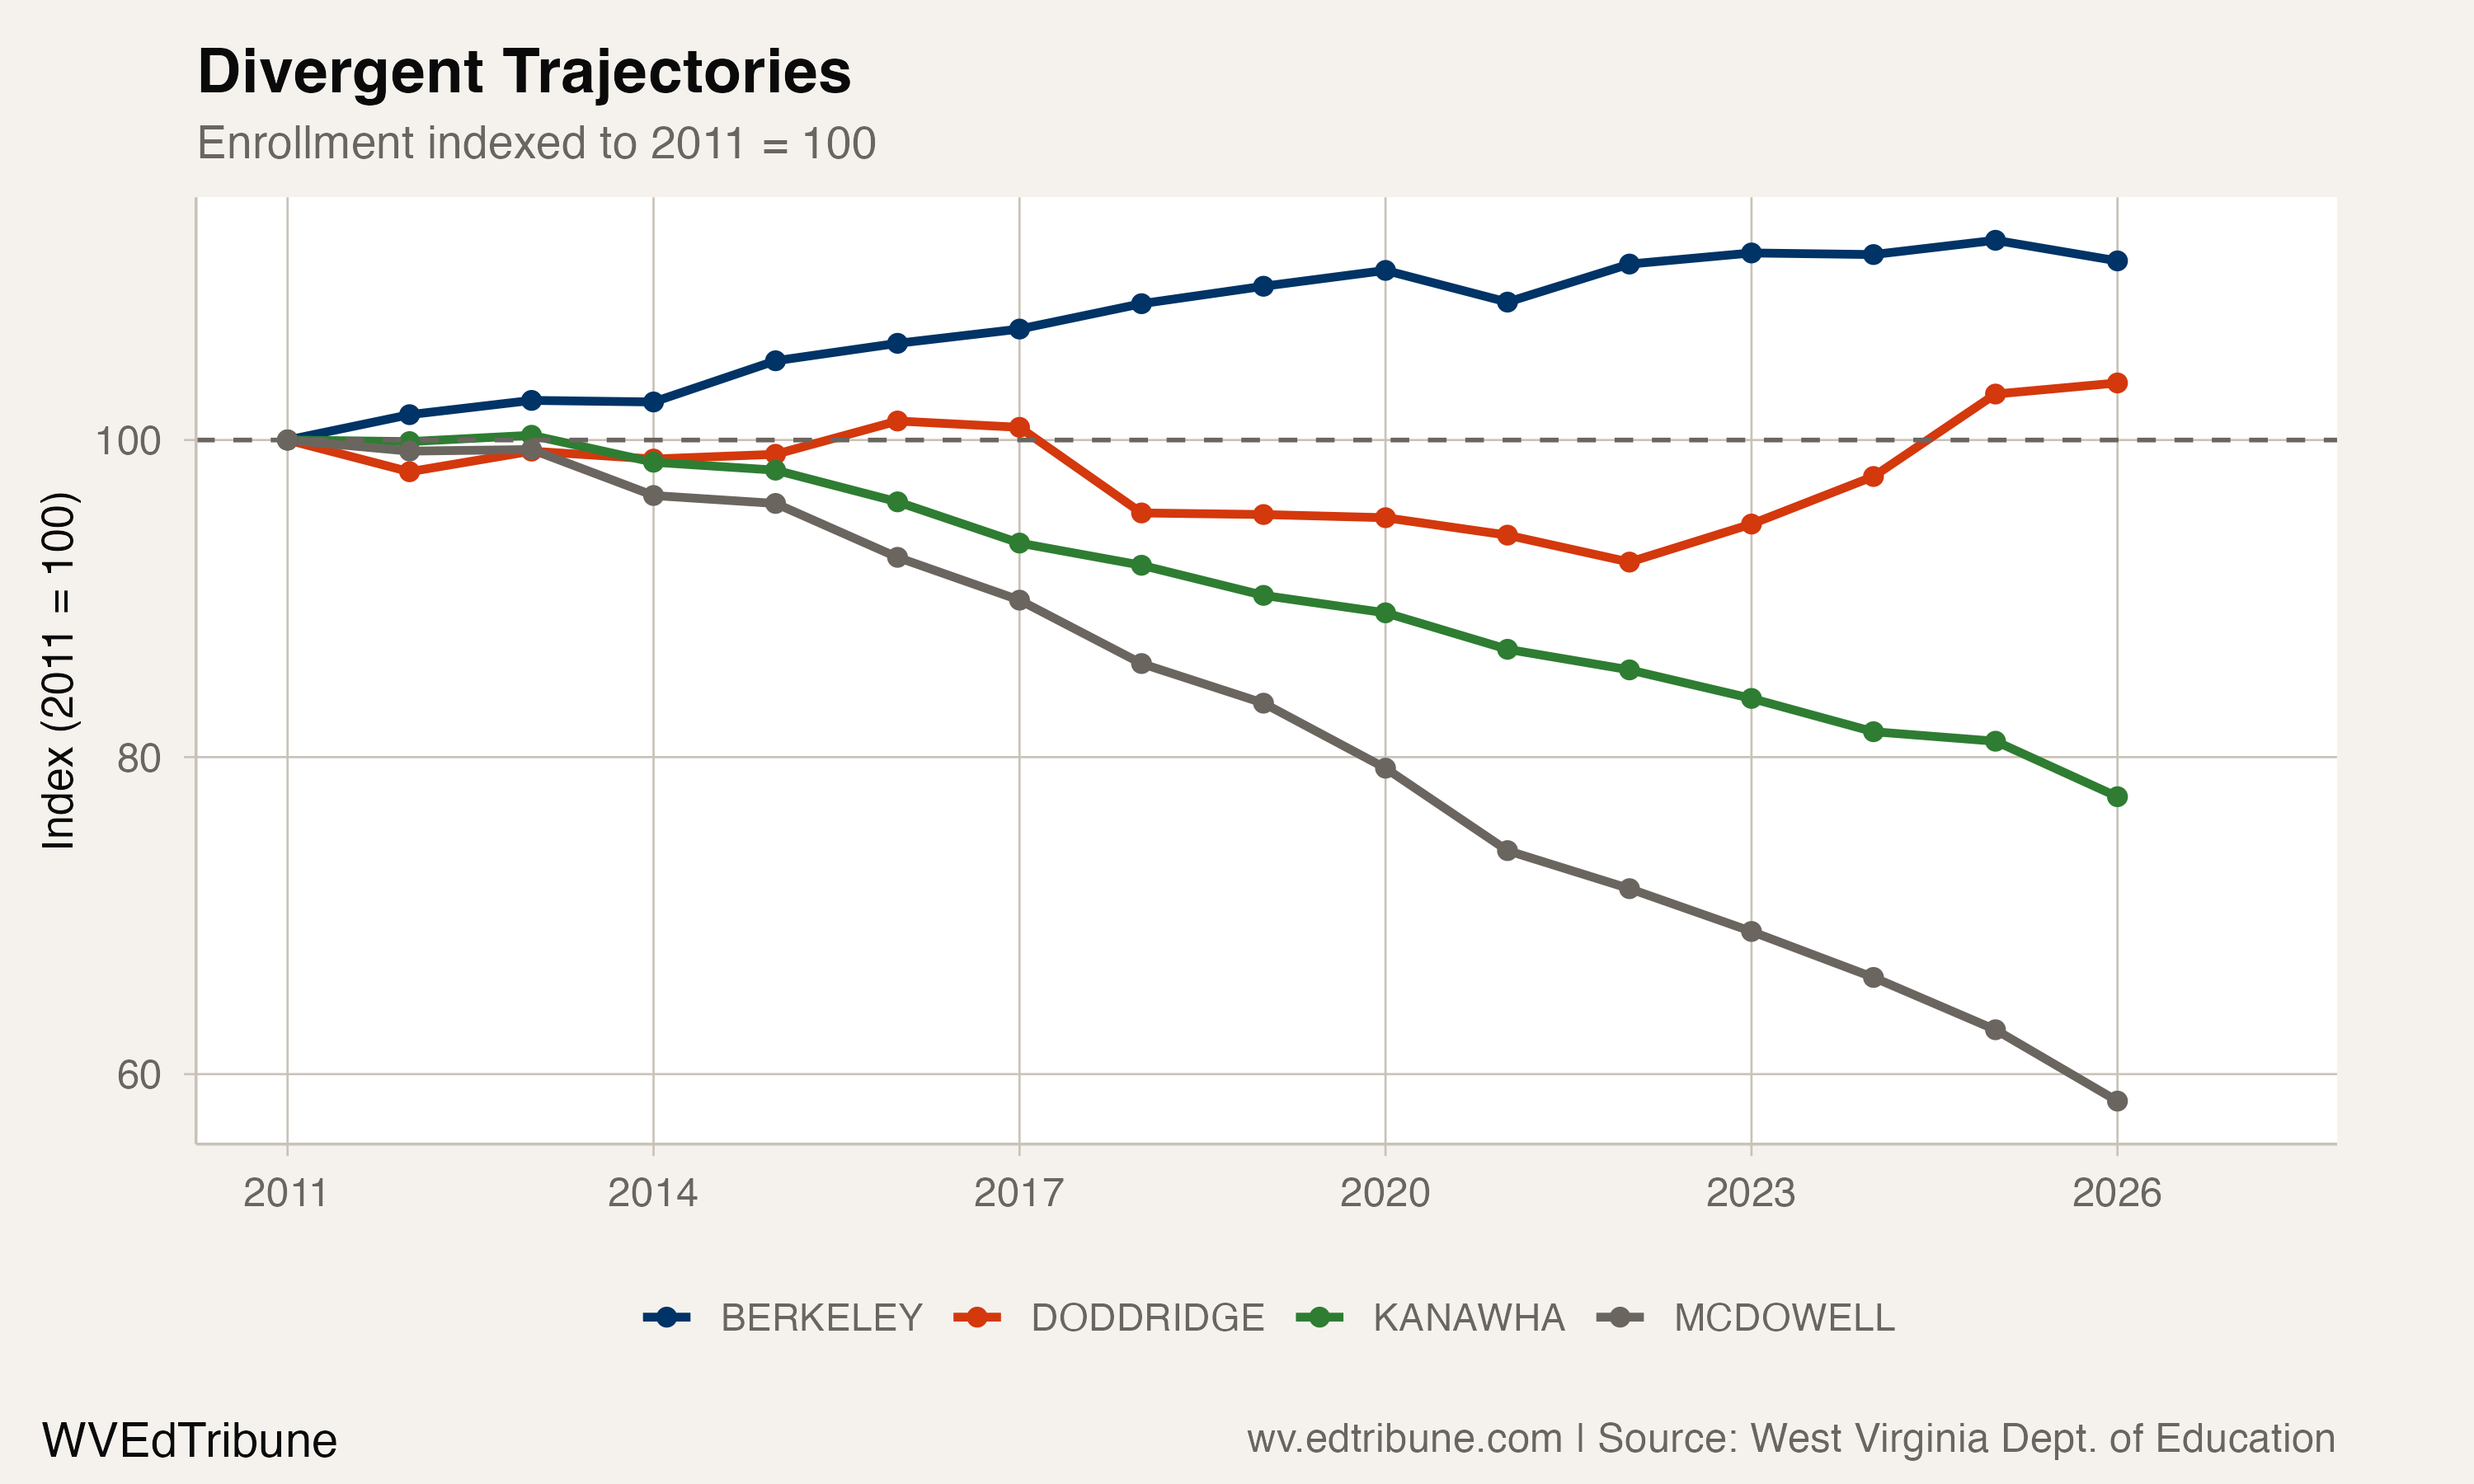
Berkeley County↗ET grew from 17,720 students in 2011 to 19,797 in 2026, a gain of 2,077 students, or 11.7%. Its enrollment was higher in 2025, when it reached 19,965. Monongalia County↗ET grew from 10,731 to 11,070, a gain of 339 students, or 3.2%, but remains below its 2018 peak of 11,595.
Those are the only three county systems with more students in 2026 than in 2011. The seven systems above their historical minimum are Berkeley, Doddridge, Hampshire, Hardy, Mineral, Monongalia and Tyler. Every other county system is at its lowest point in the available panel.
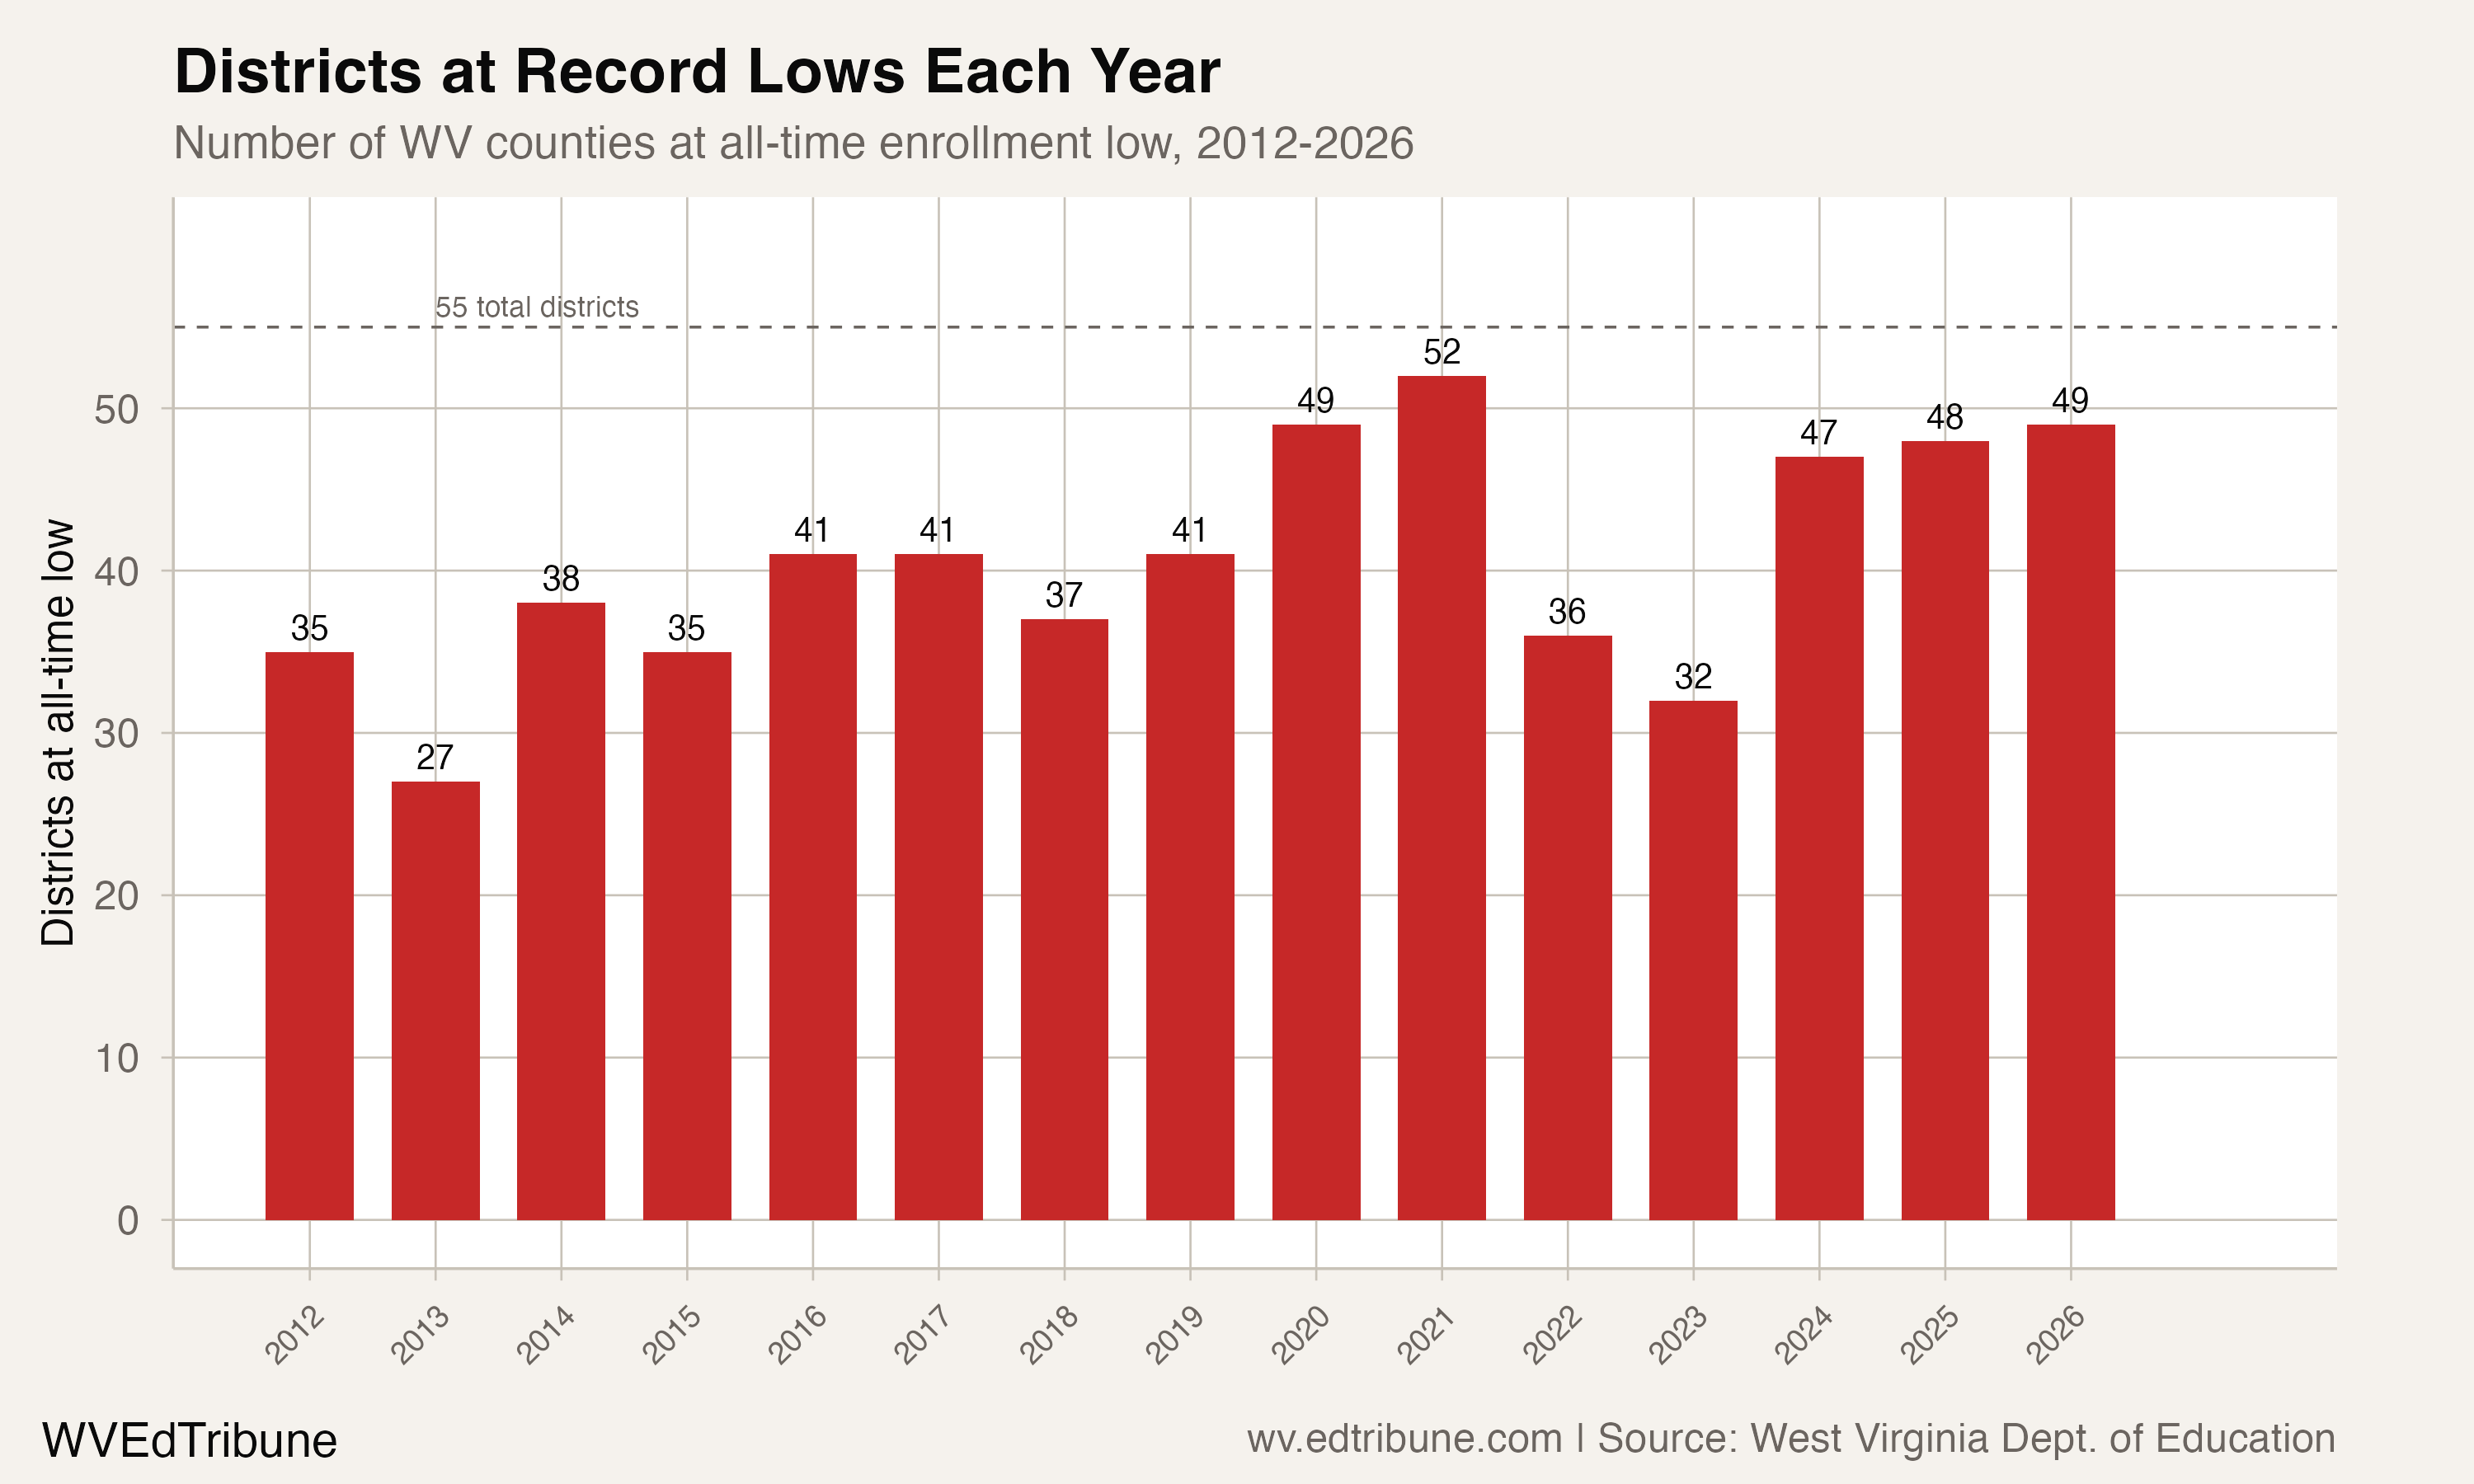
The count of systems at a historical low fell from 52 in 2021 to 29 in 2023, then rose to 46 in 2024 and 48 in both 2025 and 2026. The post-pandemic improvement in the count was temporary; it did not produce a broad return to earlier enrollment levels.
A statewide decline with a long runway
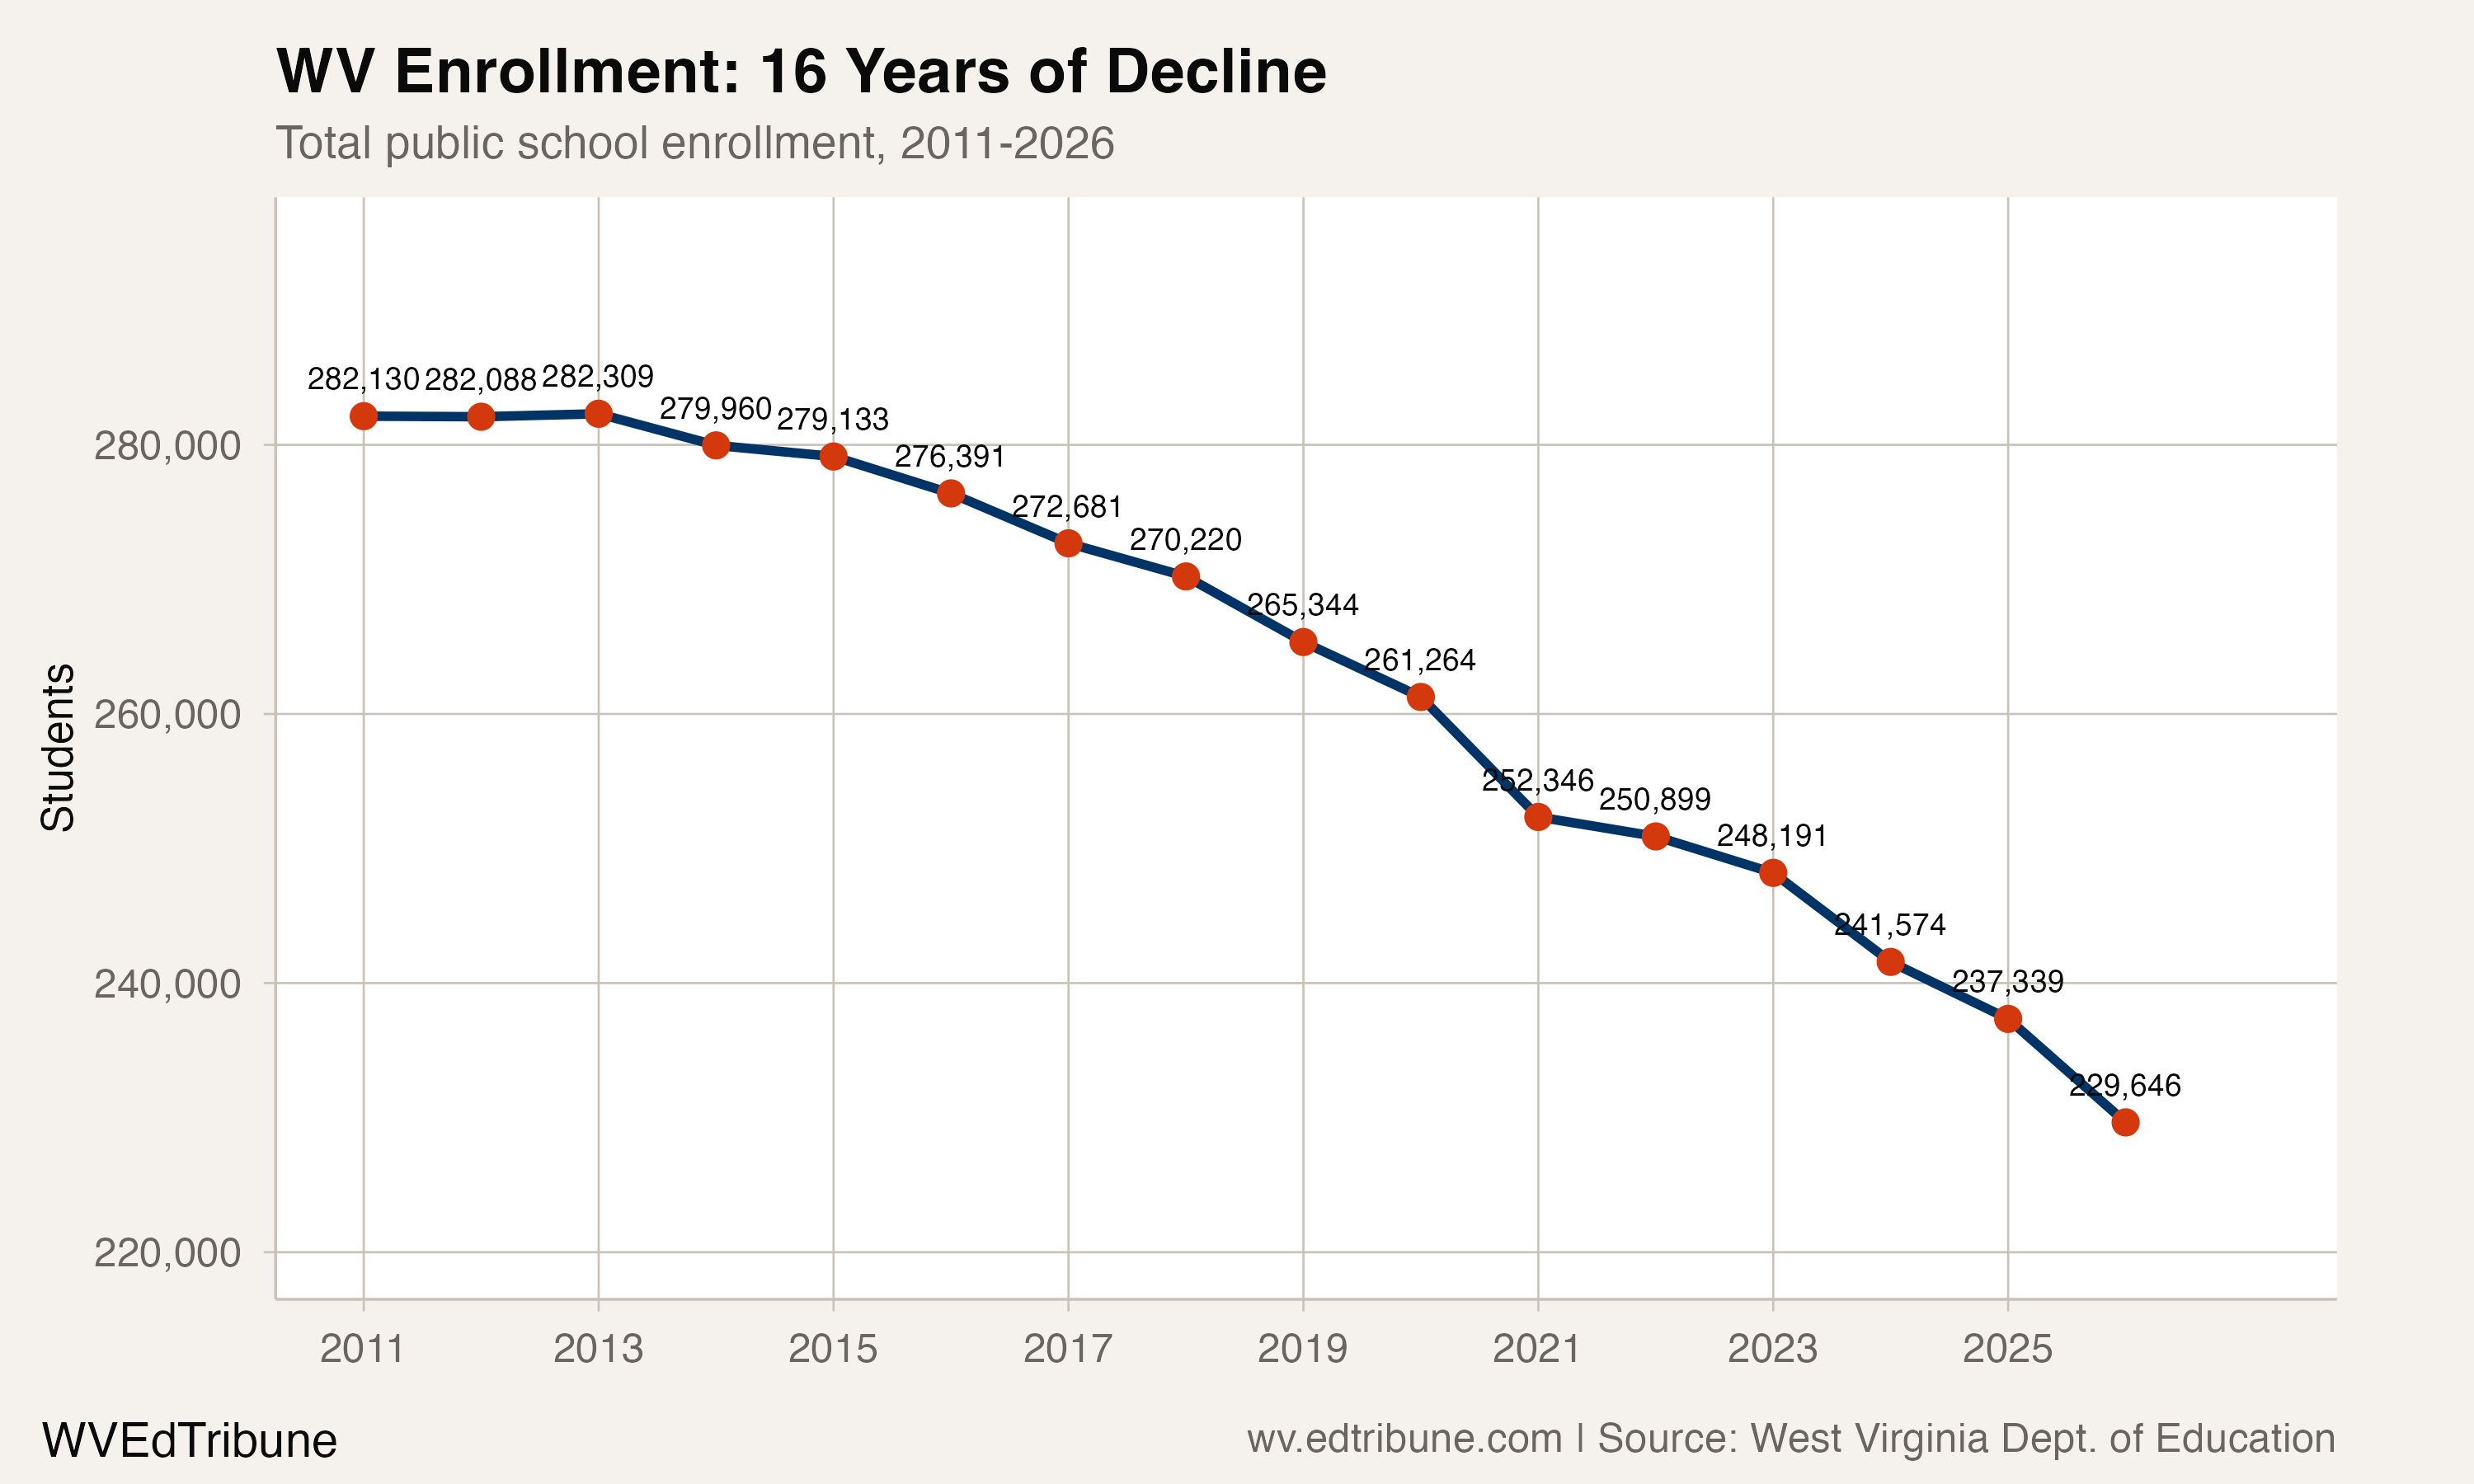
West Virginia's enrollment peaked at 282,309 in 2013. The 2026 total is 47,352 students below that peak, a 16.8% decline. State enrollment has fallen for 13 consecutive annual transitions since the last growth year, 2013.
The 2025-26 loss ranked second by size in the 2011-2026 panel. The 2021 loss was larger, at 9,276 students. The current loss is therefore part of a longer series rather than a single-year outlier.
Size offers little insulation
The low-enrollment designation is spread across the size range. All seven systems with fewer than 1,000 students are at historical lows. So are 13 of the 14 systems with 3,000 to fewer than 5,000 students and all seven systems with 5,000 to fewer than 10,000 students.
The cutoffs are descriptive, not official categories. The conclusion does not depend on one boundary: the analysis tests several alternatives, while the headline count uses the complete 55-system universe.
Kanawha leads the absolute losses
Kanawha County↗ET, the state's largest system, fell from 28,458 students in 2011 to 22,132 in 2026. That is a loss of 6,326 students, or 22.2%. Kanawha also lost 969 students in the most recent year, a 4.2% decline.
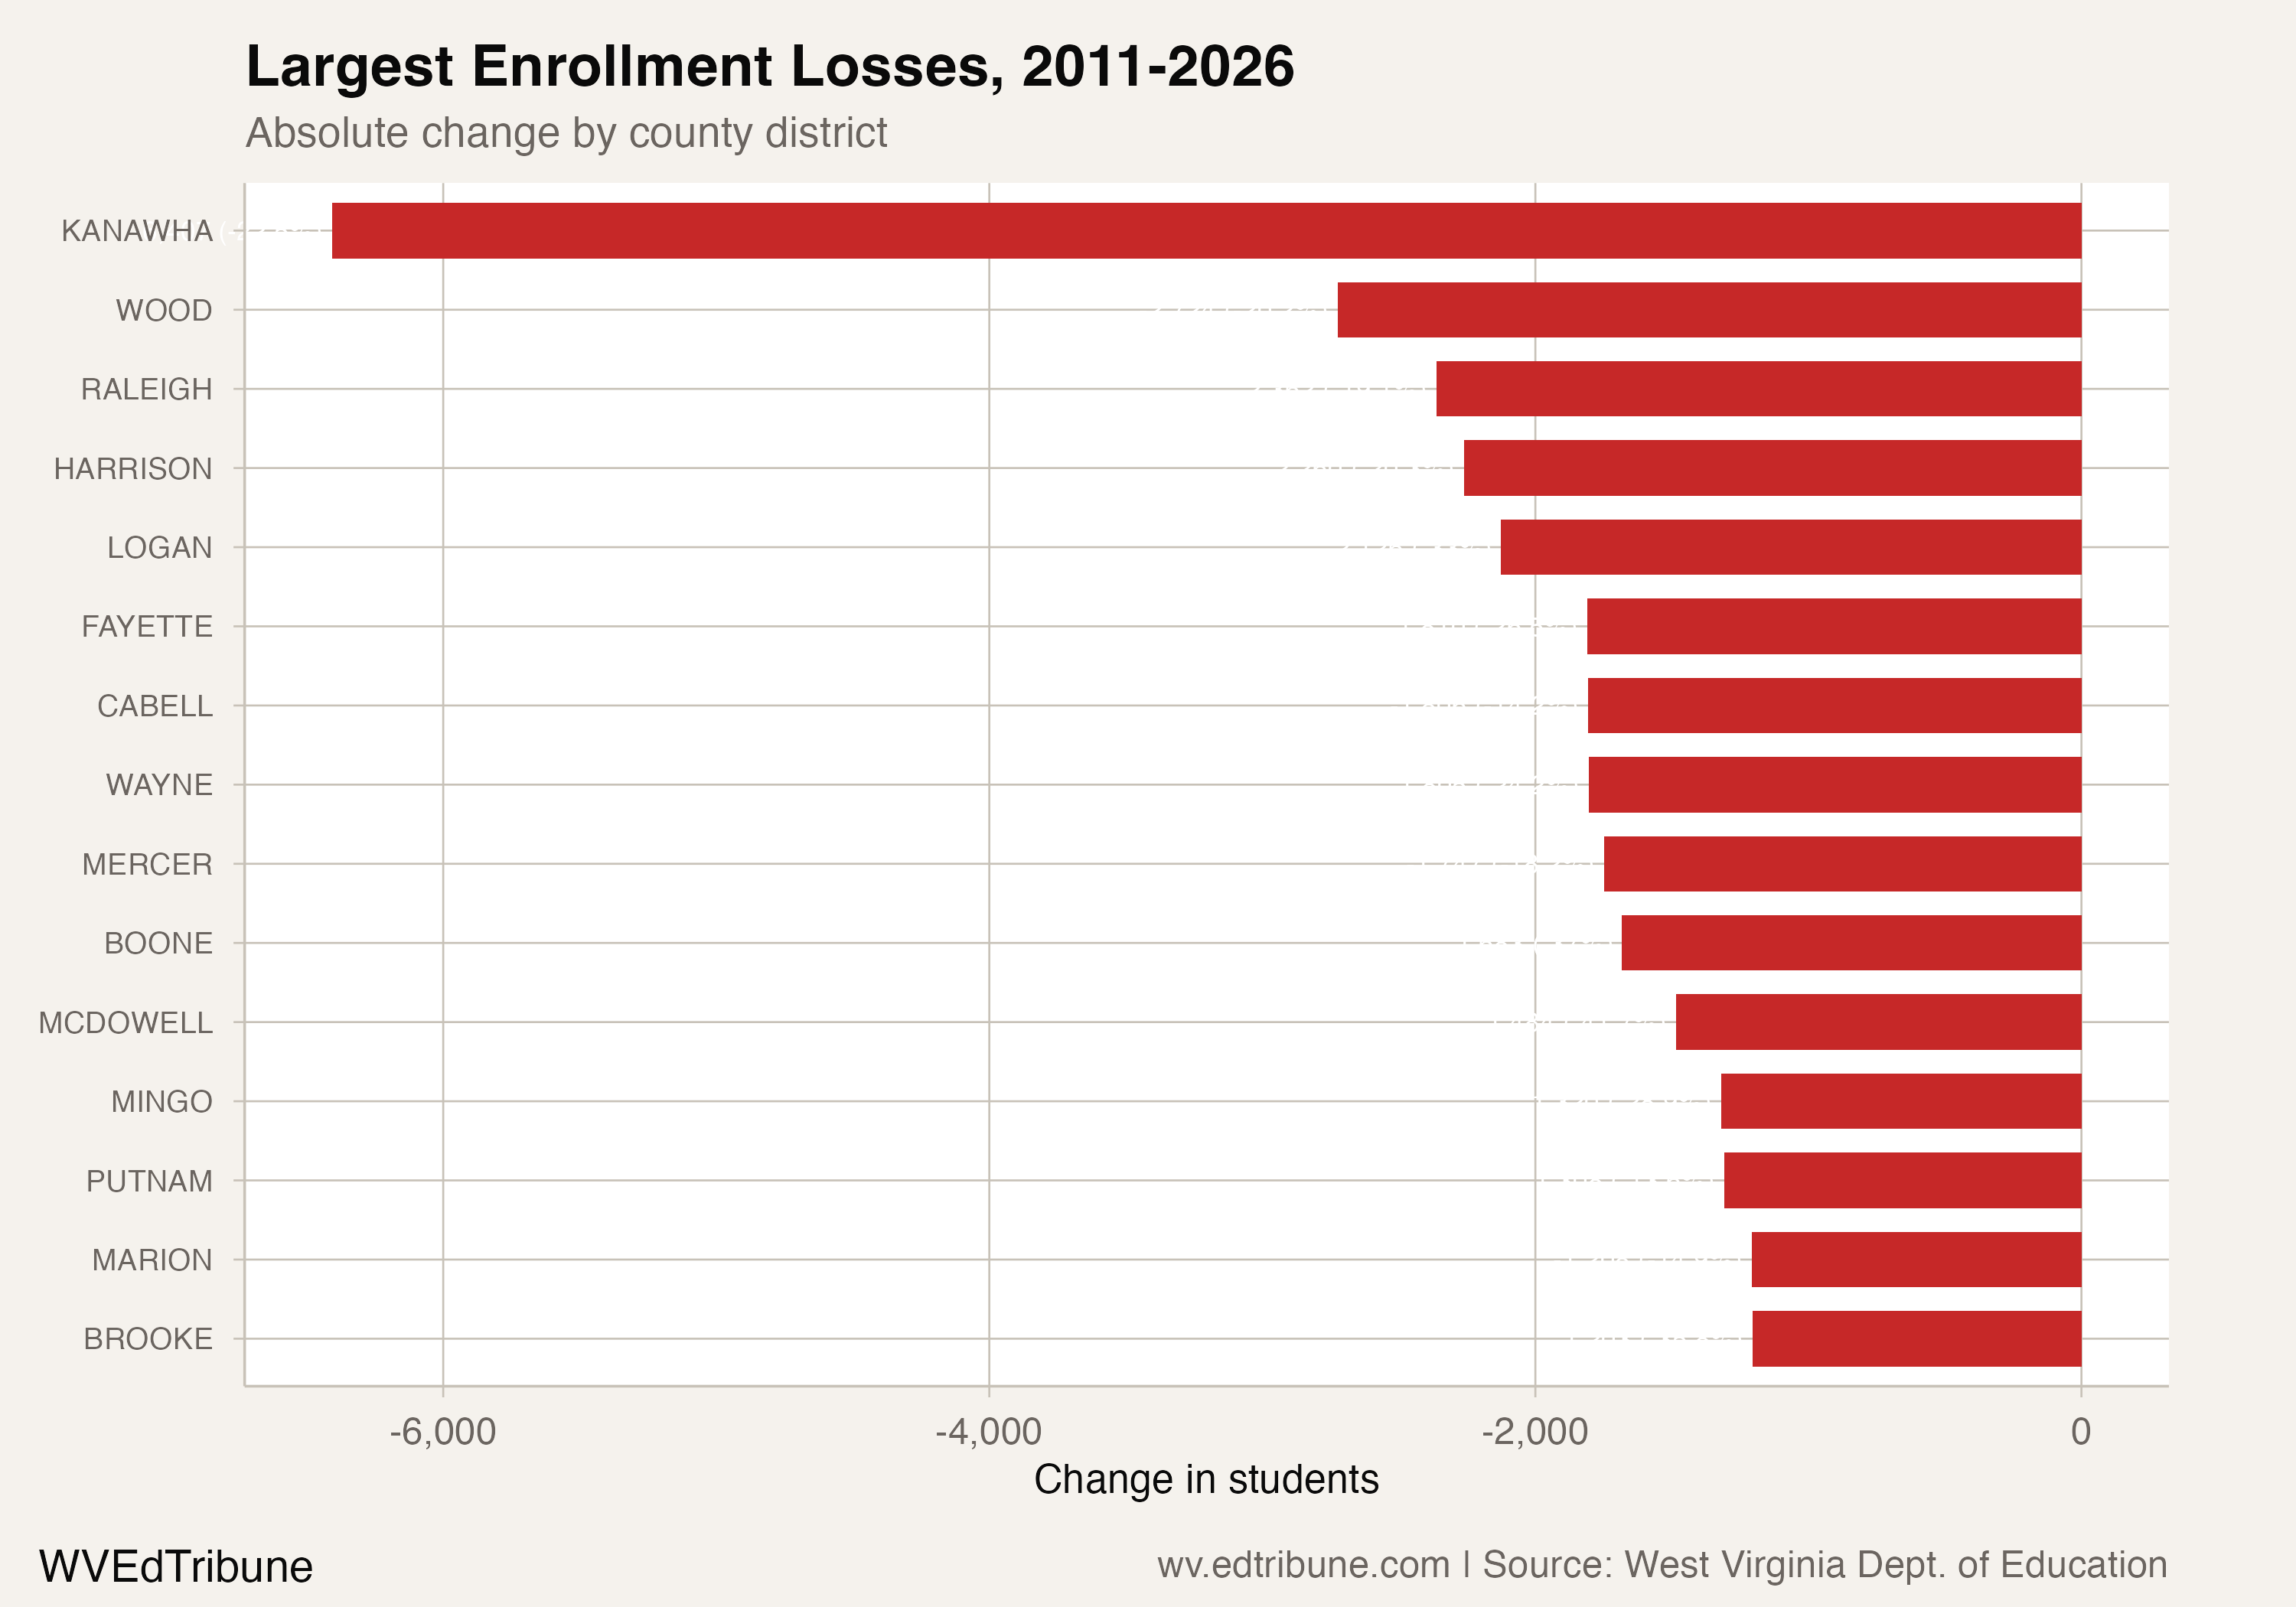
The next-largest long-run losses were 2,643 students in Wood County, 2,282 in Raleigh County and 2,202 in Harrison County. These are absolute losses; percentage rankings tell a different story.
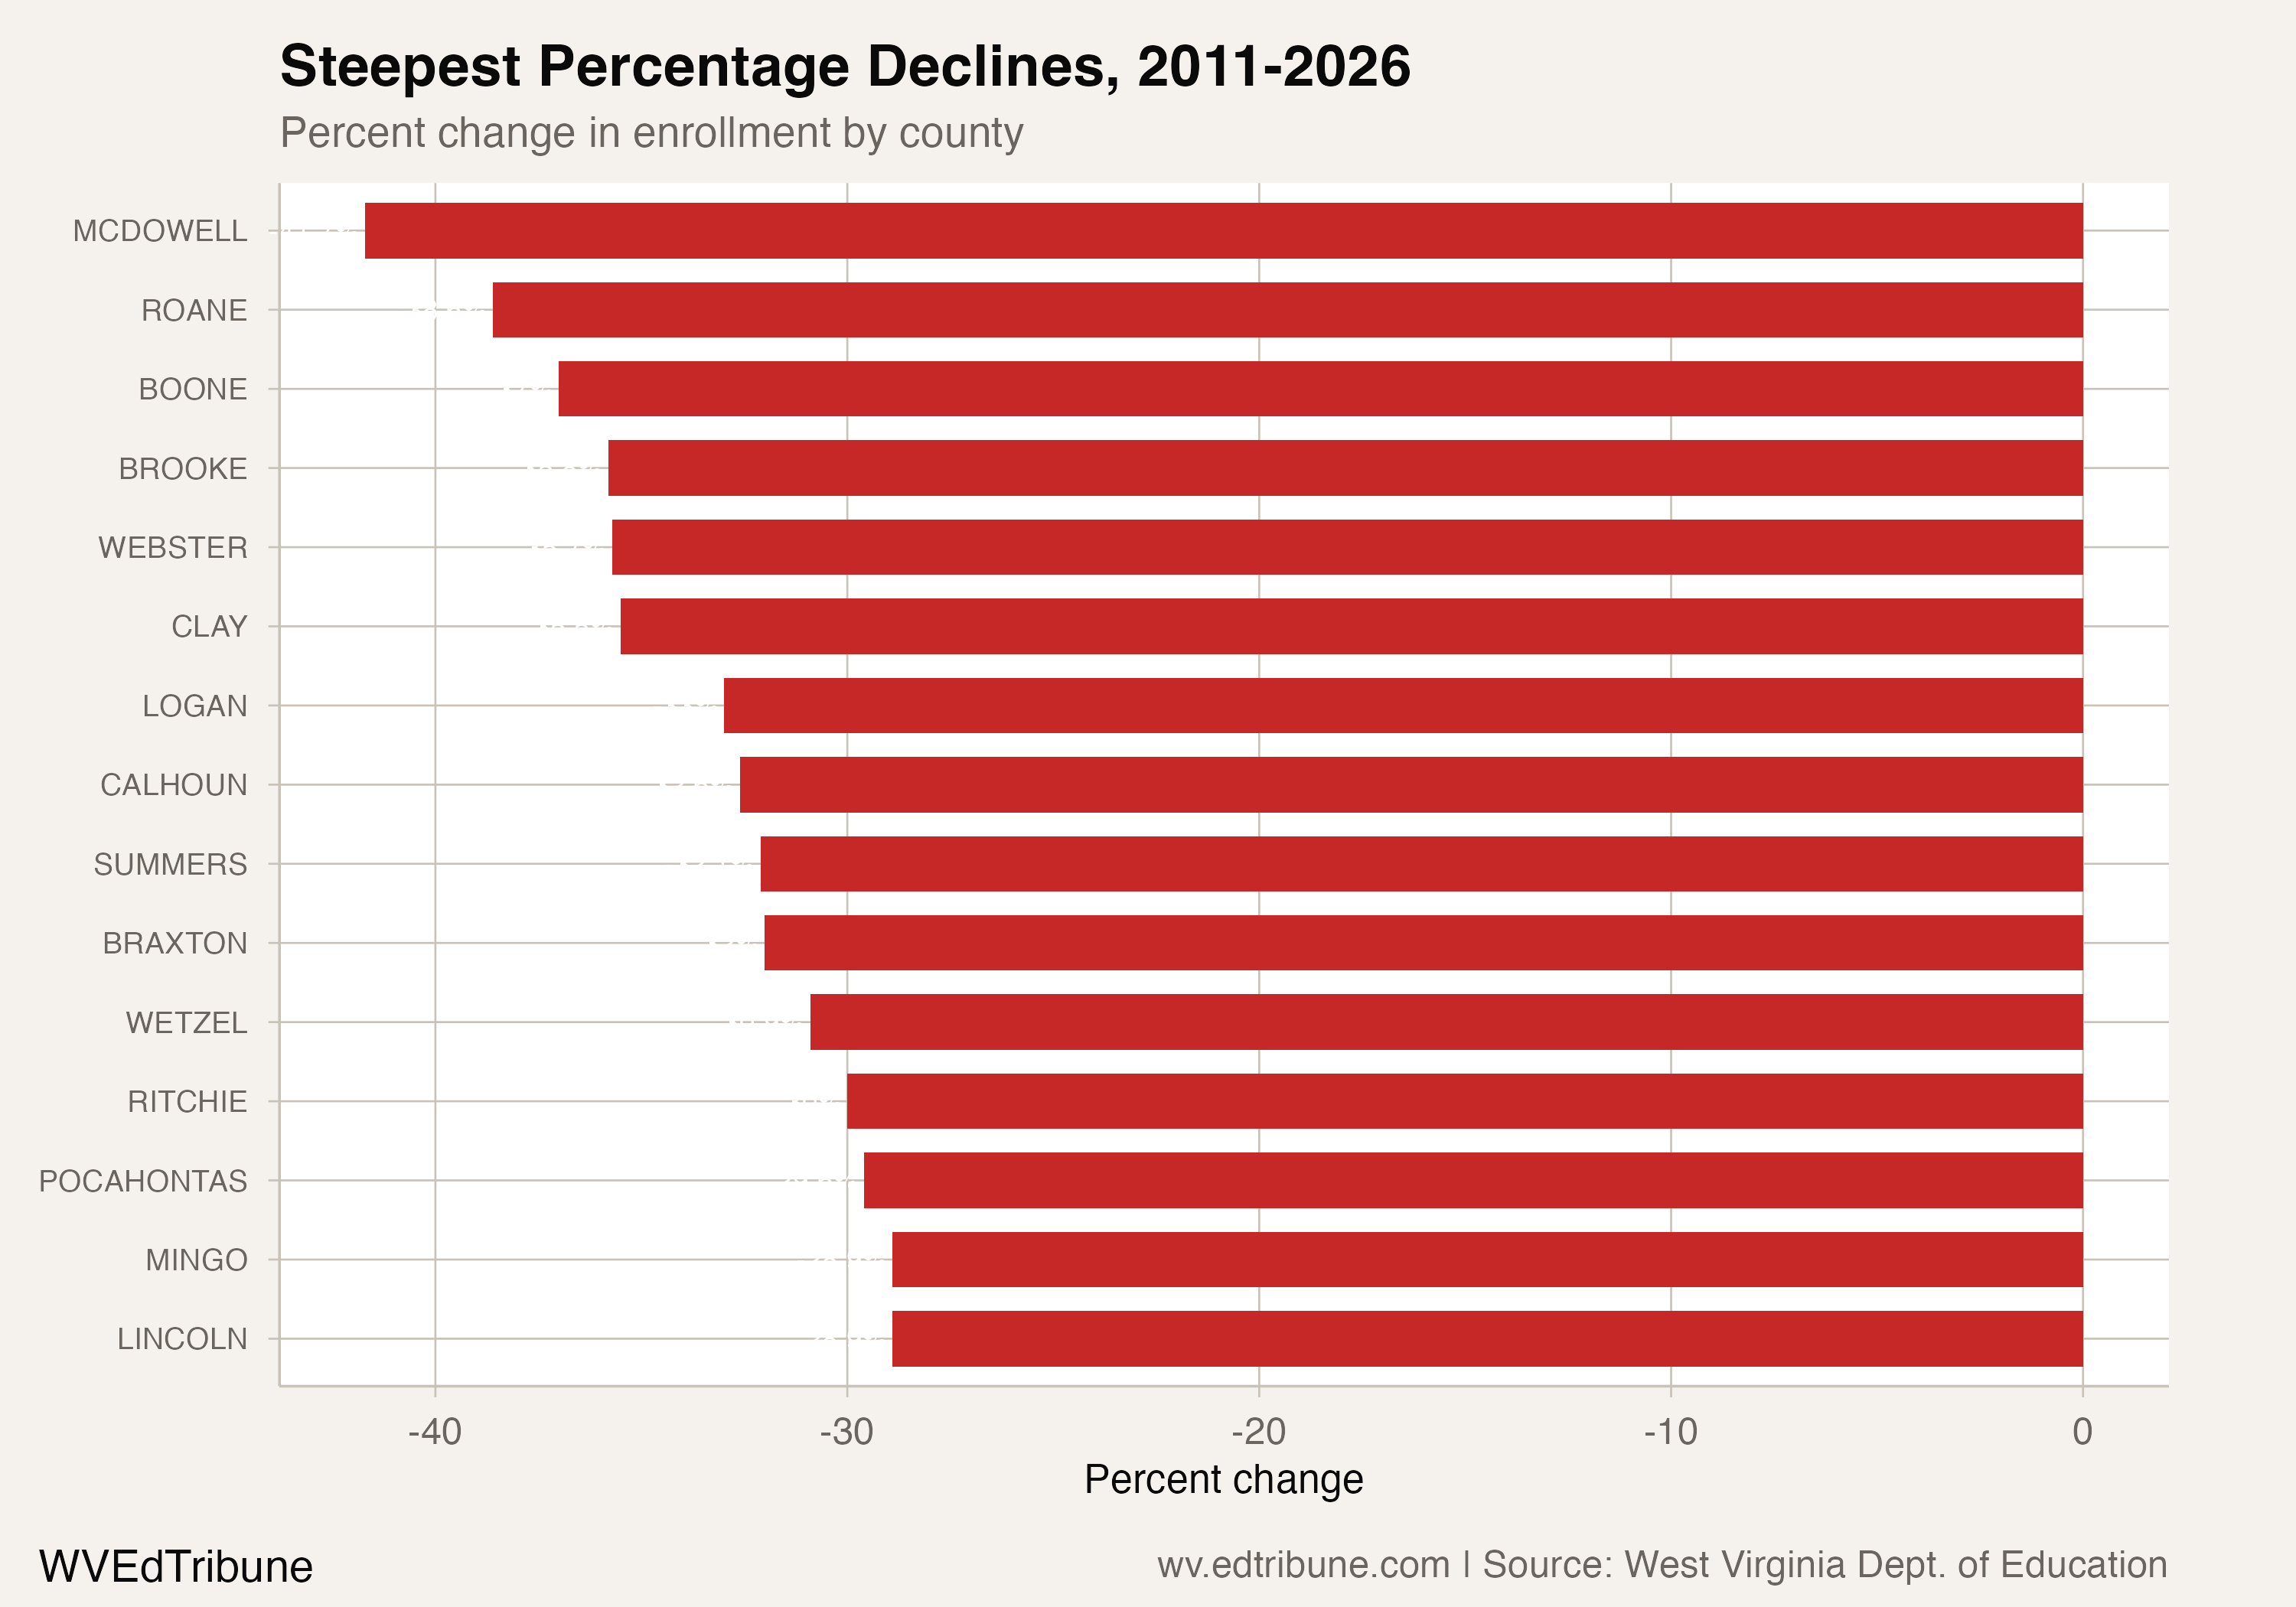
McDowell County↗ET had the steepest percentage decline among the 55 systems, with 2026 enrollment of 2,089 students, 41.3% below its 2011 level. Roane↗ET was down 38.3% and Boone↗ET was down 36.9%.
The scale difference is visible in the indexed trajectories. Berkeley's 2026 enrollment stood at 111.7 when 2011 is the index baseline; McDowell's stood at 58.7.
A planning signal in the grade spine
The state-level grade counts point to a smaller incoming cohort, but they do not forecast a particular graduating class. Kindergarten enrollment fell from 21,776 in 2013 to 15,781 in 2026, a 27.5% decline. Grade 12 enrollment fell from 18,616 to 17,187, a 7.7% decline.
The kindergarten-to-grade-12 ratio moved from 117.0% in 2013 to 91.8% in 2026. That same-year comparison is a planning signal, not a cohort forecast: students move through the system, and the published panel does not track the same children from grade to grade.
What the panel can and cannot explain
The enrollment data establish the breadth and timing of the decline. They do not assign a reason to each change. Population movement, births, transfers between school sectors and school-choice policy are competing explanations that this panel cannot apportion.
The U.S. Census Bureau's population estimates provide demographic context, while the West Virginia Treasury's Hope Scholarship information documents a separate school-choice policy context. Neither source turns this descriptive enrollment series into a causal estimate.
The current panel's direct evidence is the same across the state: 48 county systems at historical lows, three above their 2011 enrollment and one at its highest point in the available record. Those facts leave districts with a concrete planning question about capacity, staffing and facilities, but they do not by themselves identify which mechanism should receive the blame or the remedy.
Enrollment counts come from the West Virginia Department of Education's 2025-26 enrollment data.
Detailed code that reproduces the analysis and figures in this article is available exclusively to EdTribune subscribers.
Discussion
Sign in to join the discussion.
Loading comments...