Correction: An earlier version used stale enrollment values. This version uses the current West Virginia Department of Education enrollment release and re-runs the full 2011-2026 panel.
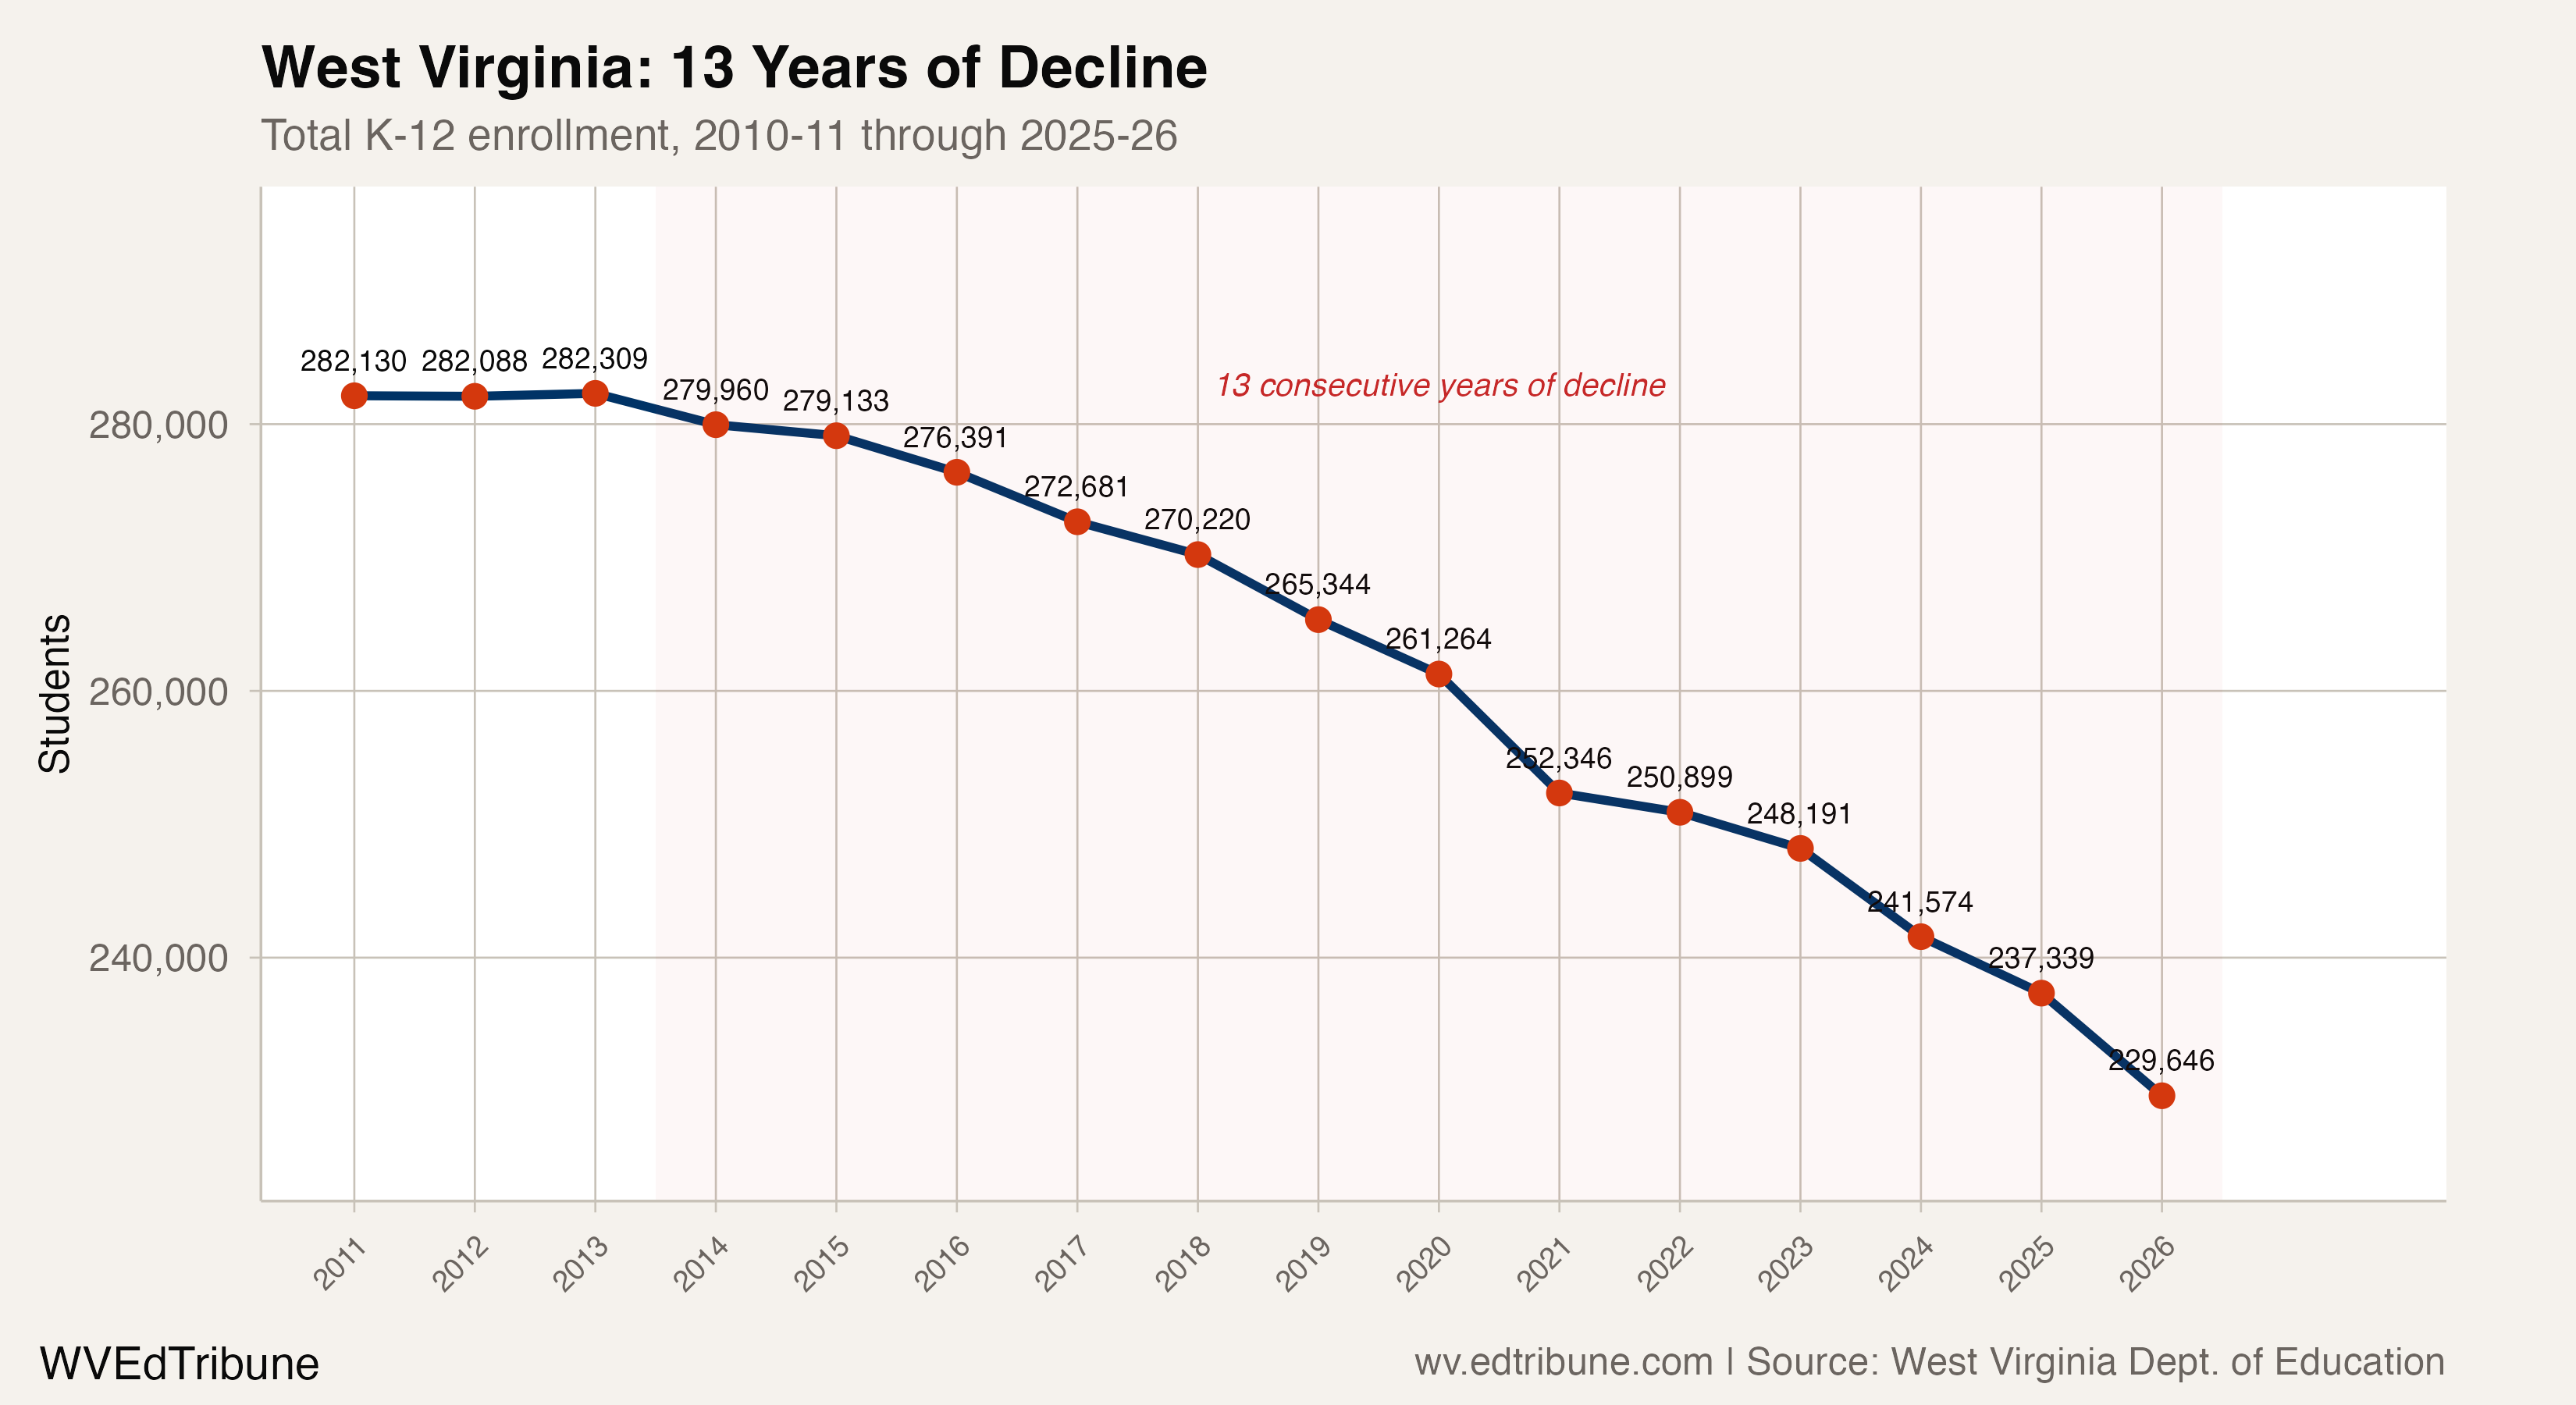
West Virginia public schools lost 6,067 students in 2025-26, bringing statewide enrollment to 234,957. It was the 13th consecutive annual loss after the state’s 2013 peak of 282,309 students.
The decline from that peak is 47,352 students, or 16.8%. Measured from 2011, the state has lost 47,173 students, or 16.7%. The current panel is descriptive: it shows what changed, not how much of the change came from births, migration, transfers, school choice or reporting practices.
The pace has changed, but the direction has not
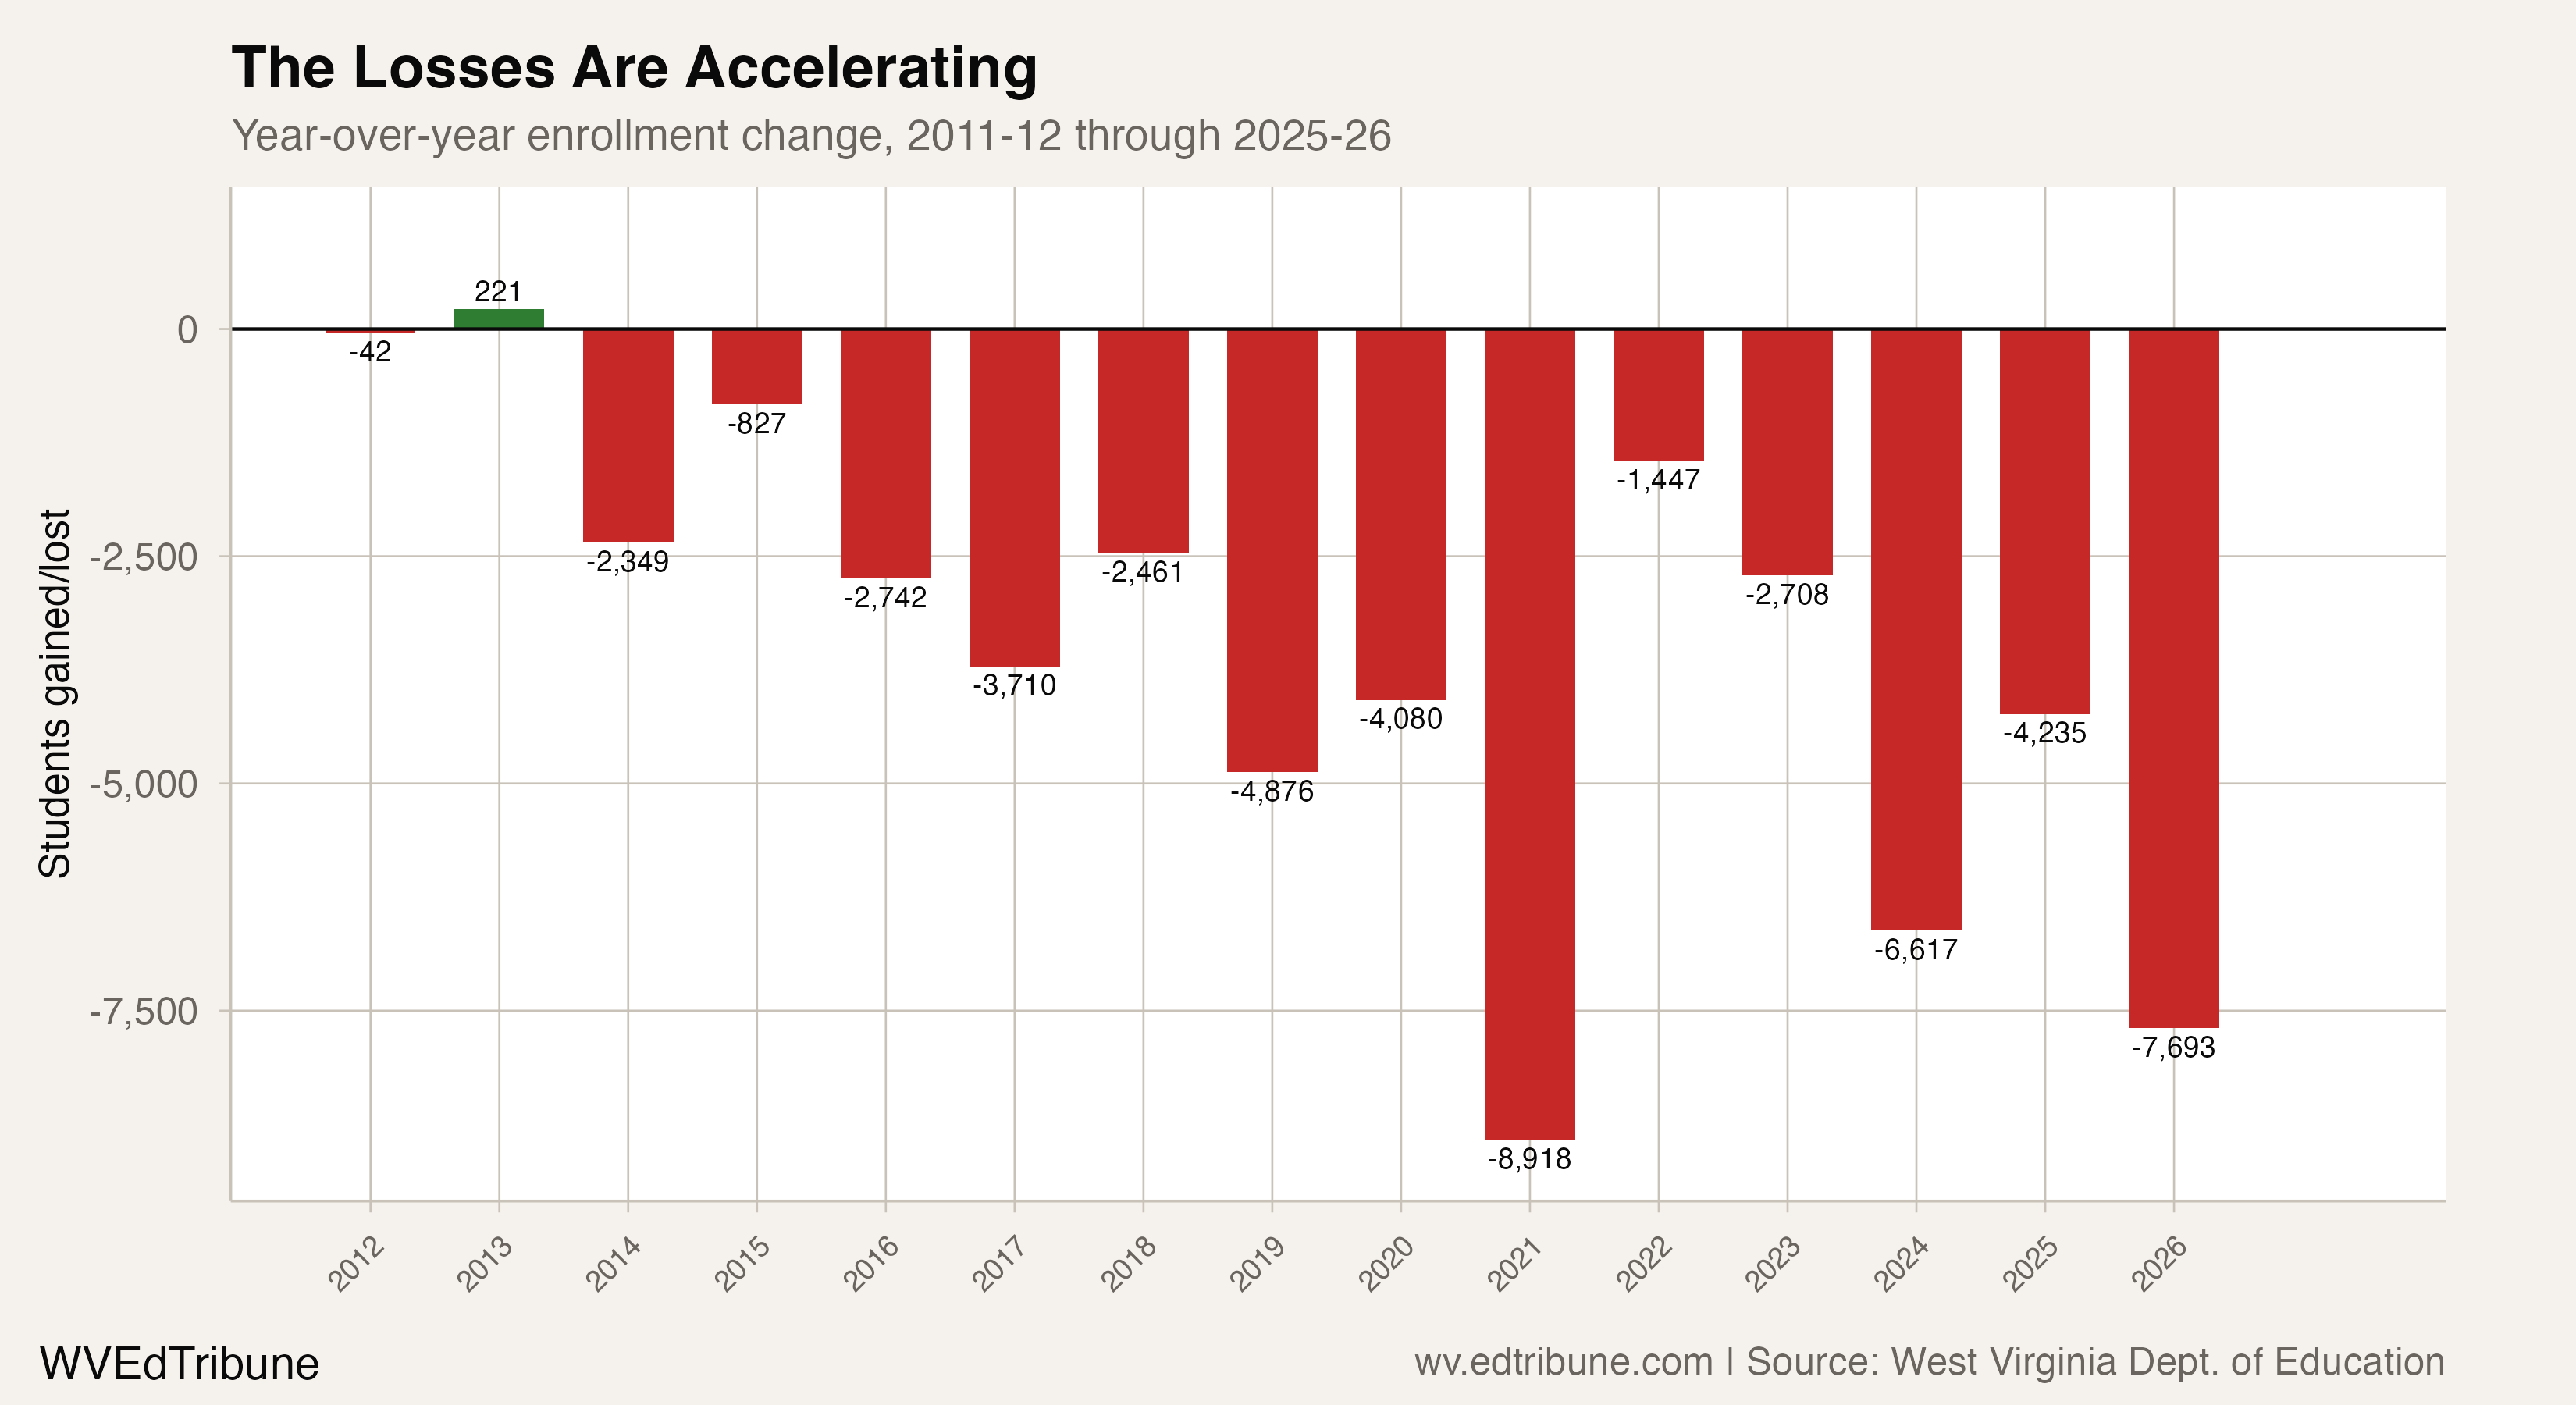
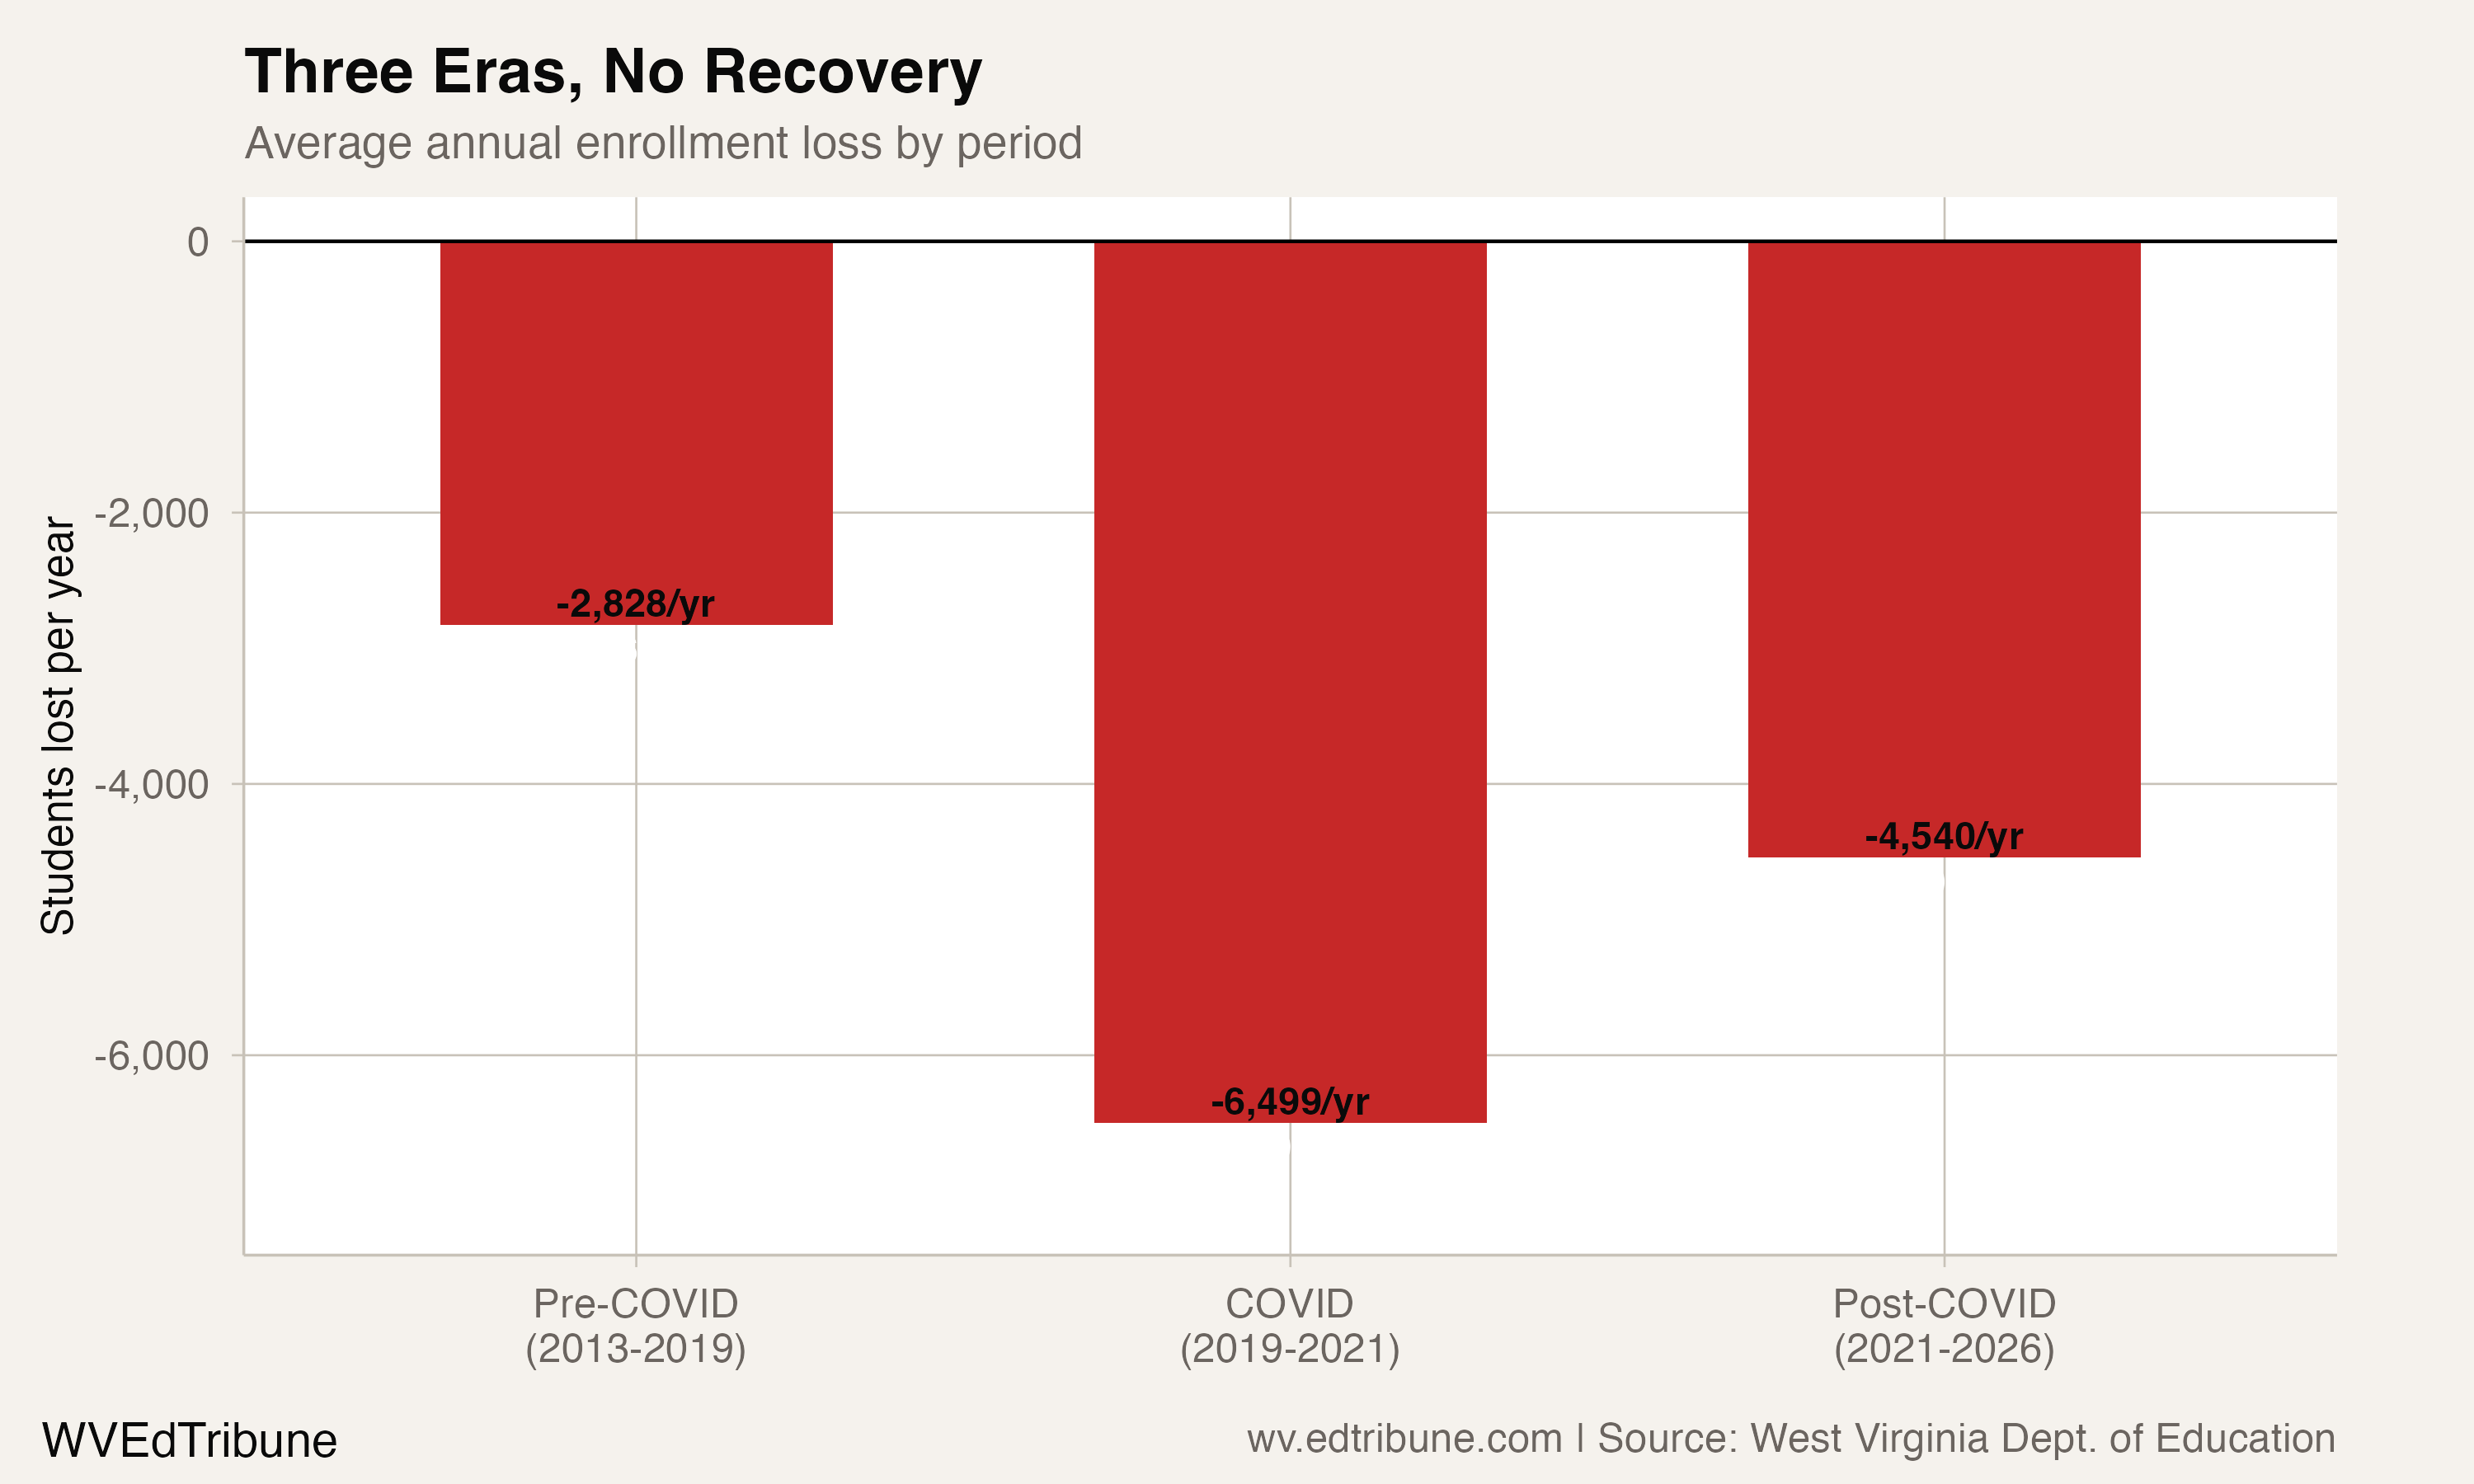
The years after the 2013 peak divide into three periods. From 2013-14 through 2018-19, enrollment fell by 16,554 students, an average loss of 2,759 per year. From 2019-20 through 2020-21, the state lost 13,398 students in two years, averaging 6,699 per year. From 2021-22 through 2025-26, it lost another 17,400, averaging 3,480 per year.
The post-pandemic period has produced the larger total loss of the three periods, while the two-year COVID period had the steepest annual average. The 2025-26 loss of 6,067 students was smaller than the 9,276-student loss in 2020-21, but it was still the state’s second-largest loss in the current panel.
The losses are concentrated in the largest systems
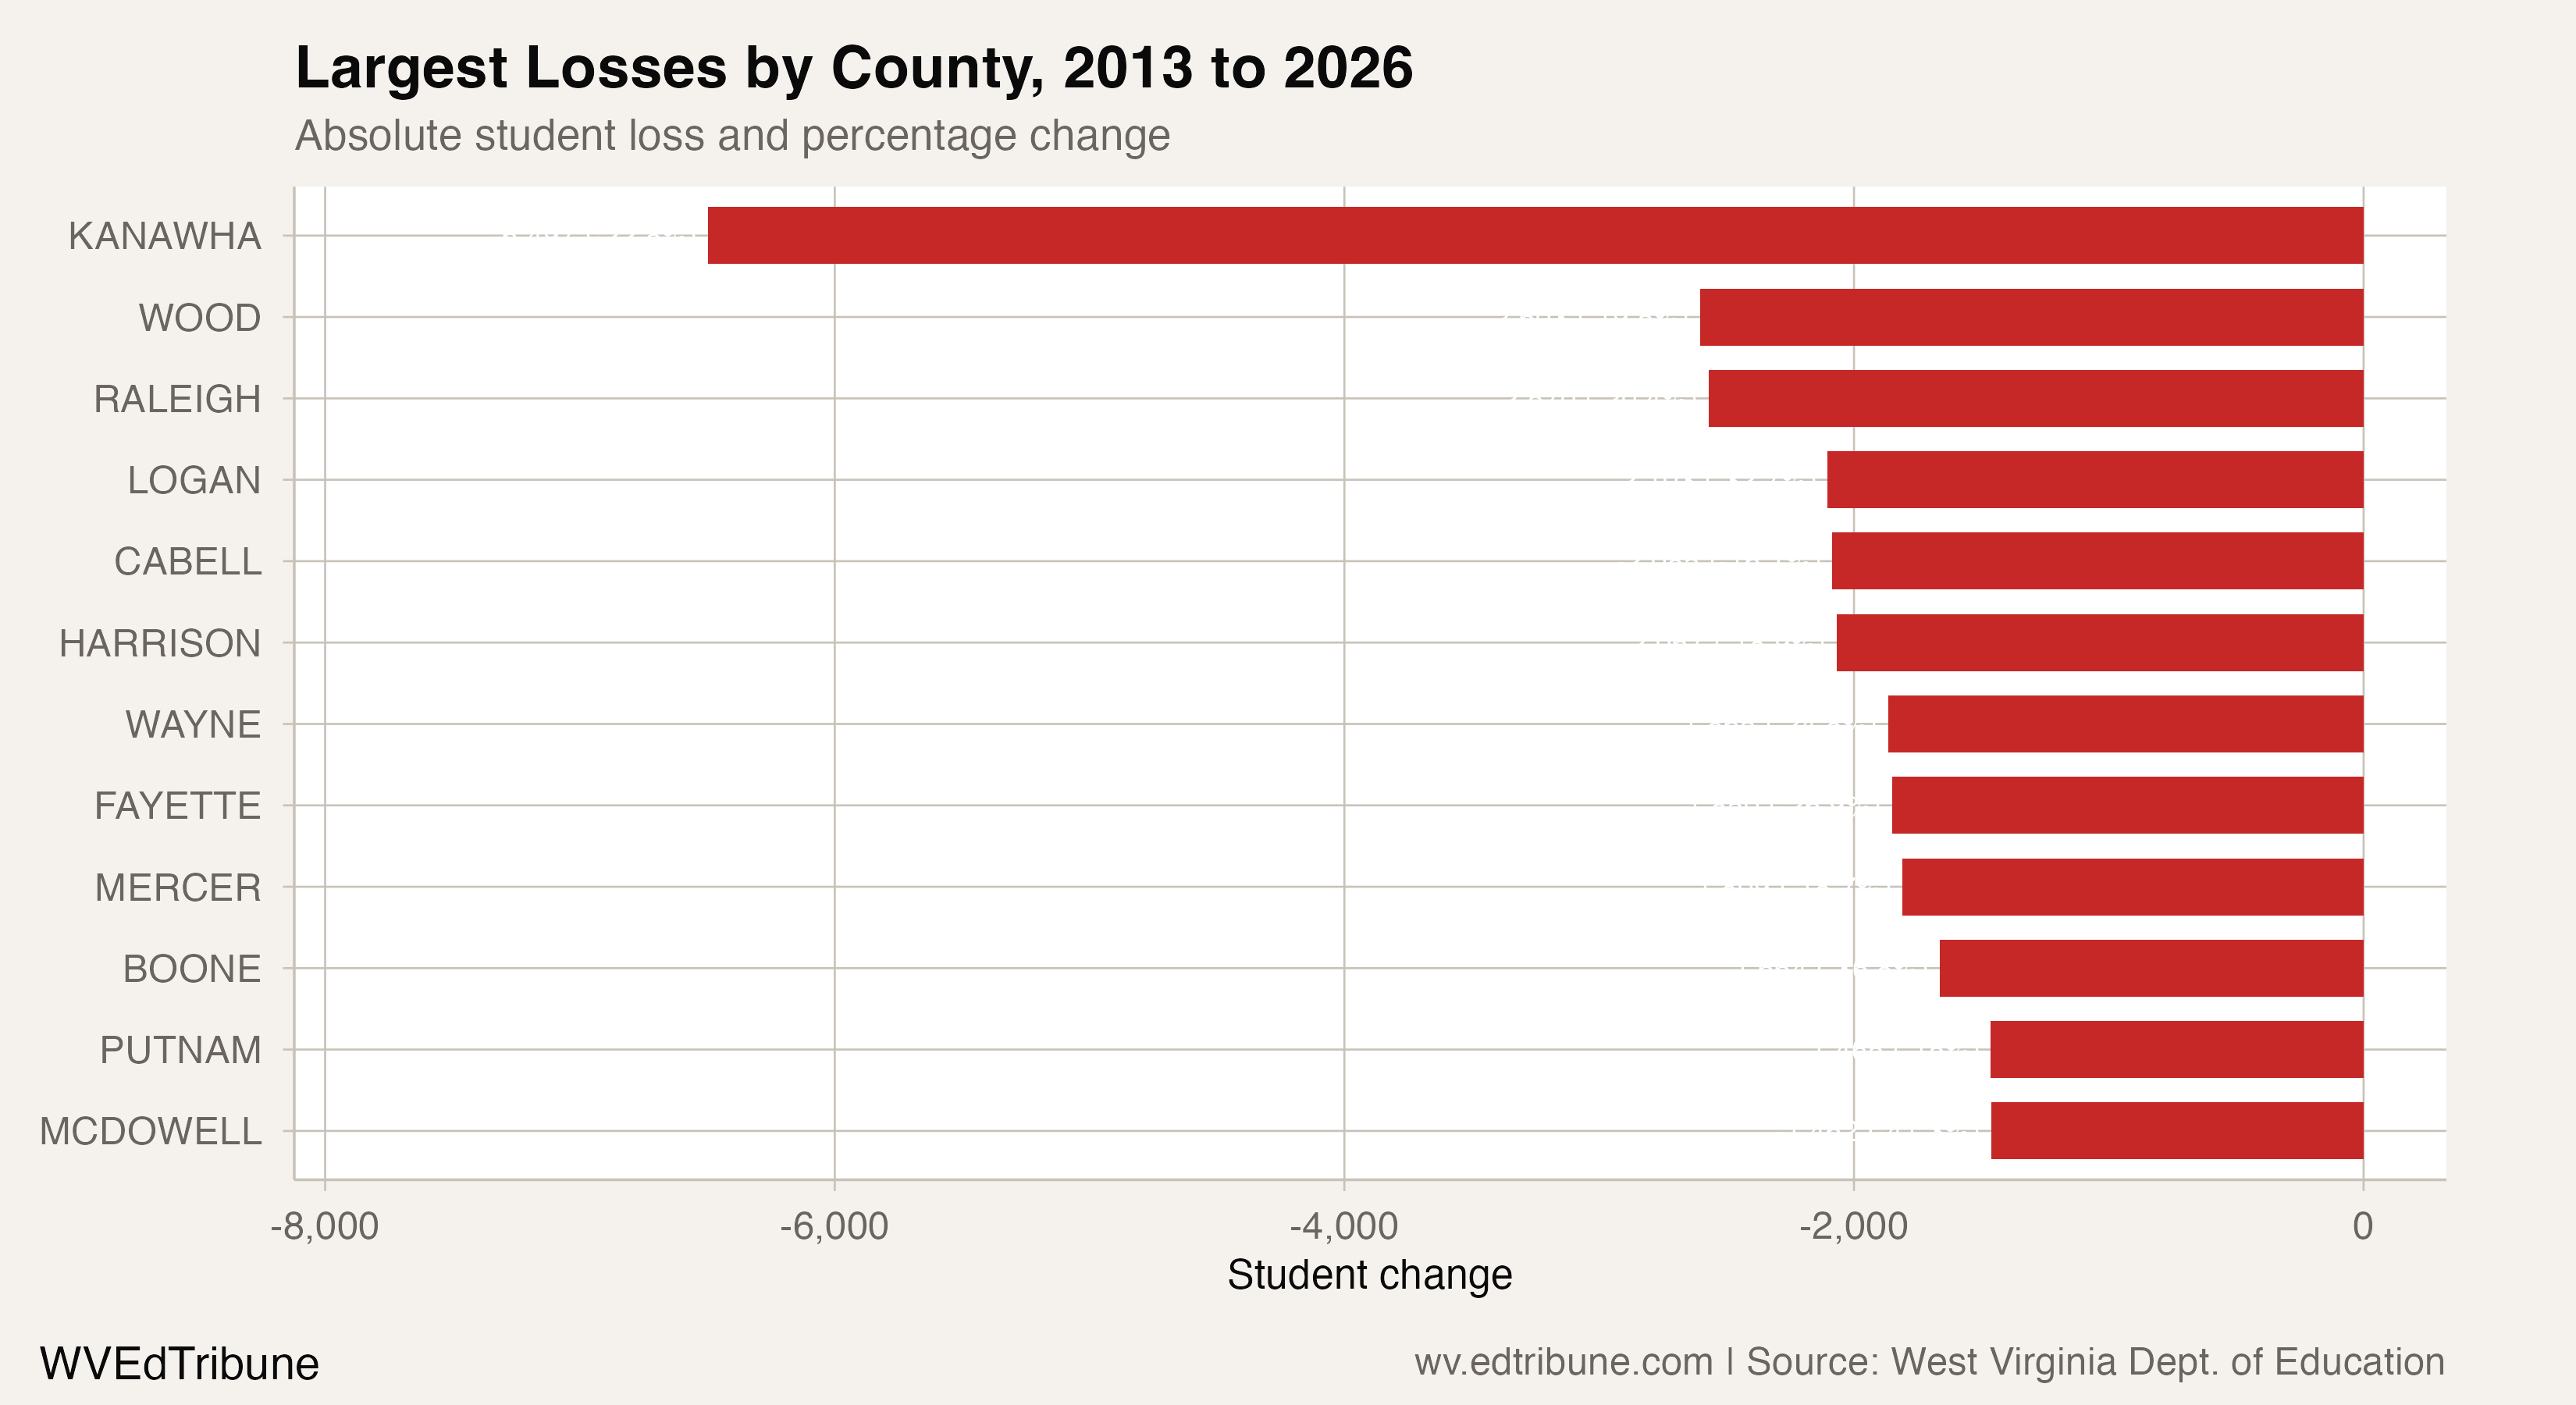
Forty-eight of the state’s 55 county systems were at their lowest enrollment in the 2011-2026 panel in 2026. Only two systems—Berkeley↗ET and Doddridge↗ET—were at or above their 2020 enrollment.
The 10 largest absolute losses totaled 24,245 students, or 51.4% of the statewide loss since 2011. Kanawha↗ET had the largest: it fell from 28,458 students in 2011 to 22,132 in 2026, a loss of 6,326 students, or 22.2%. Wood↗ET lost 2,643, Raleigh↗ET lost 2,282, and Harrison↗ET lost 2,202.
The steepest percentage decline among the large systems highlighted here was McDowell↗ET, down 41.3% from 3,559 students to 2,089. Three county systems grew over the full period: Berkeley↗ET added 2,077 students, Monongalia↗ET added 339, and Doddridge↗ET added 51.
The lower-grade pipeline is smaller
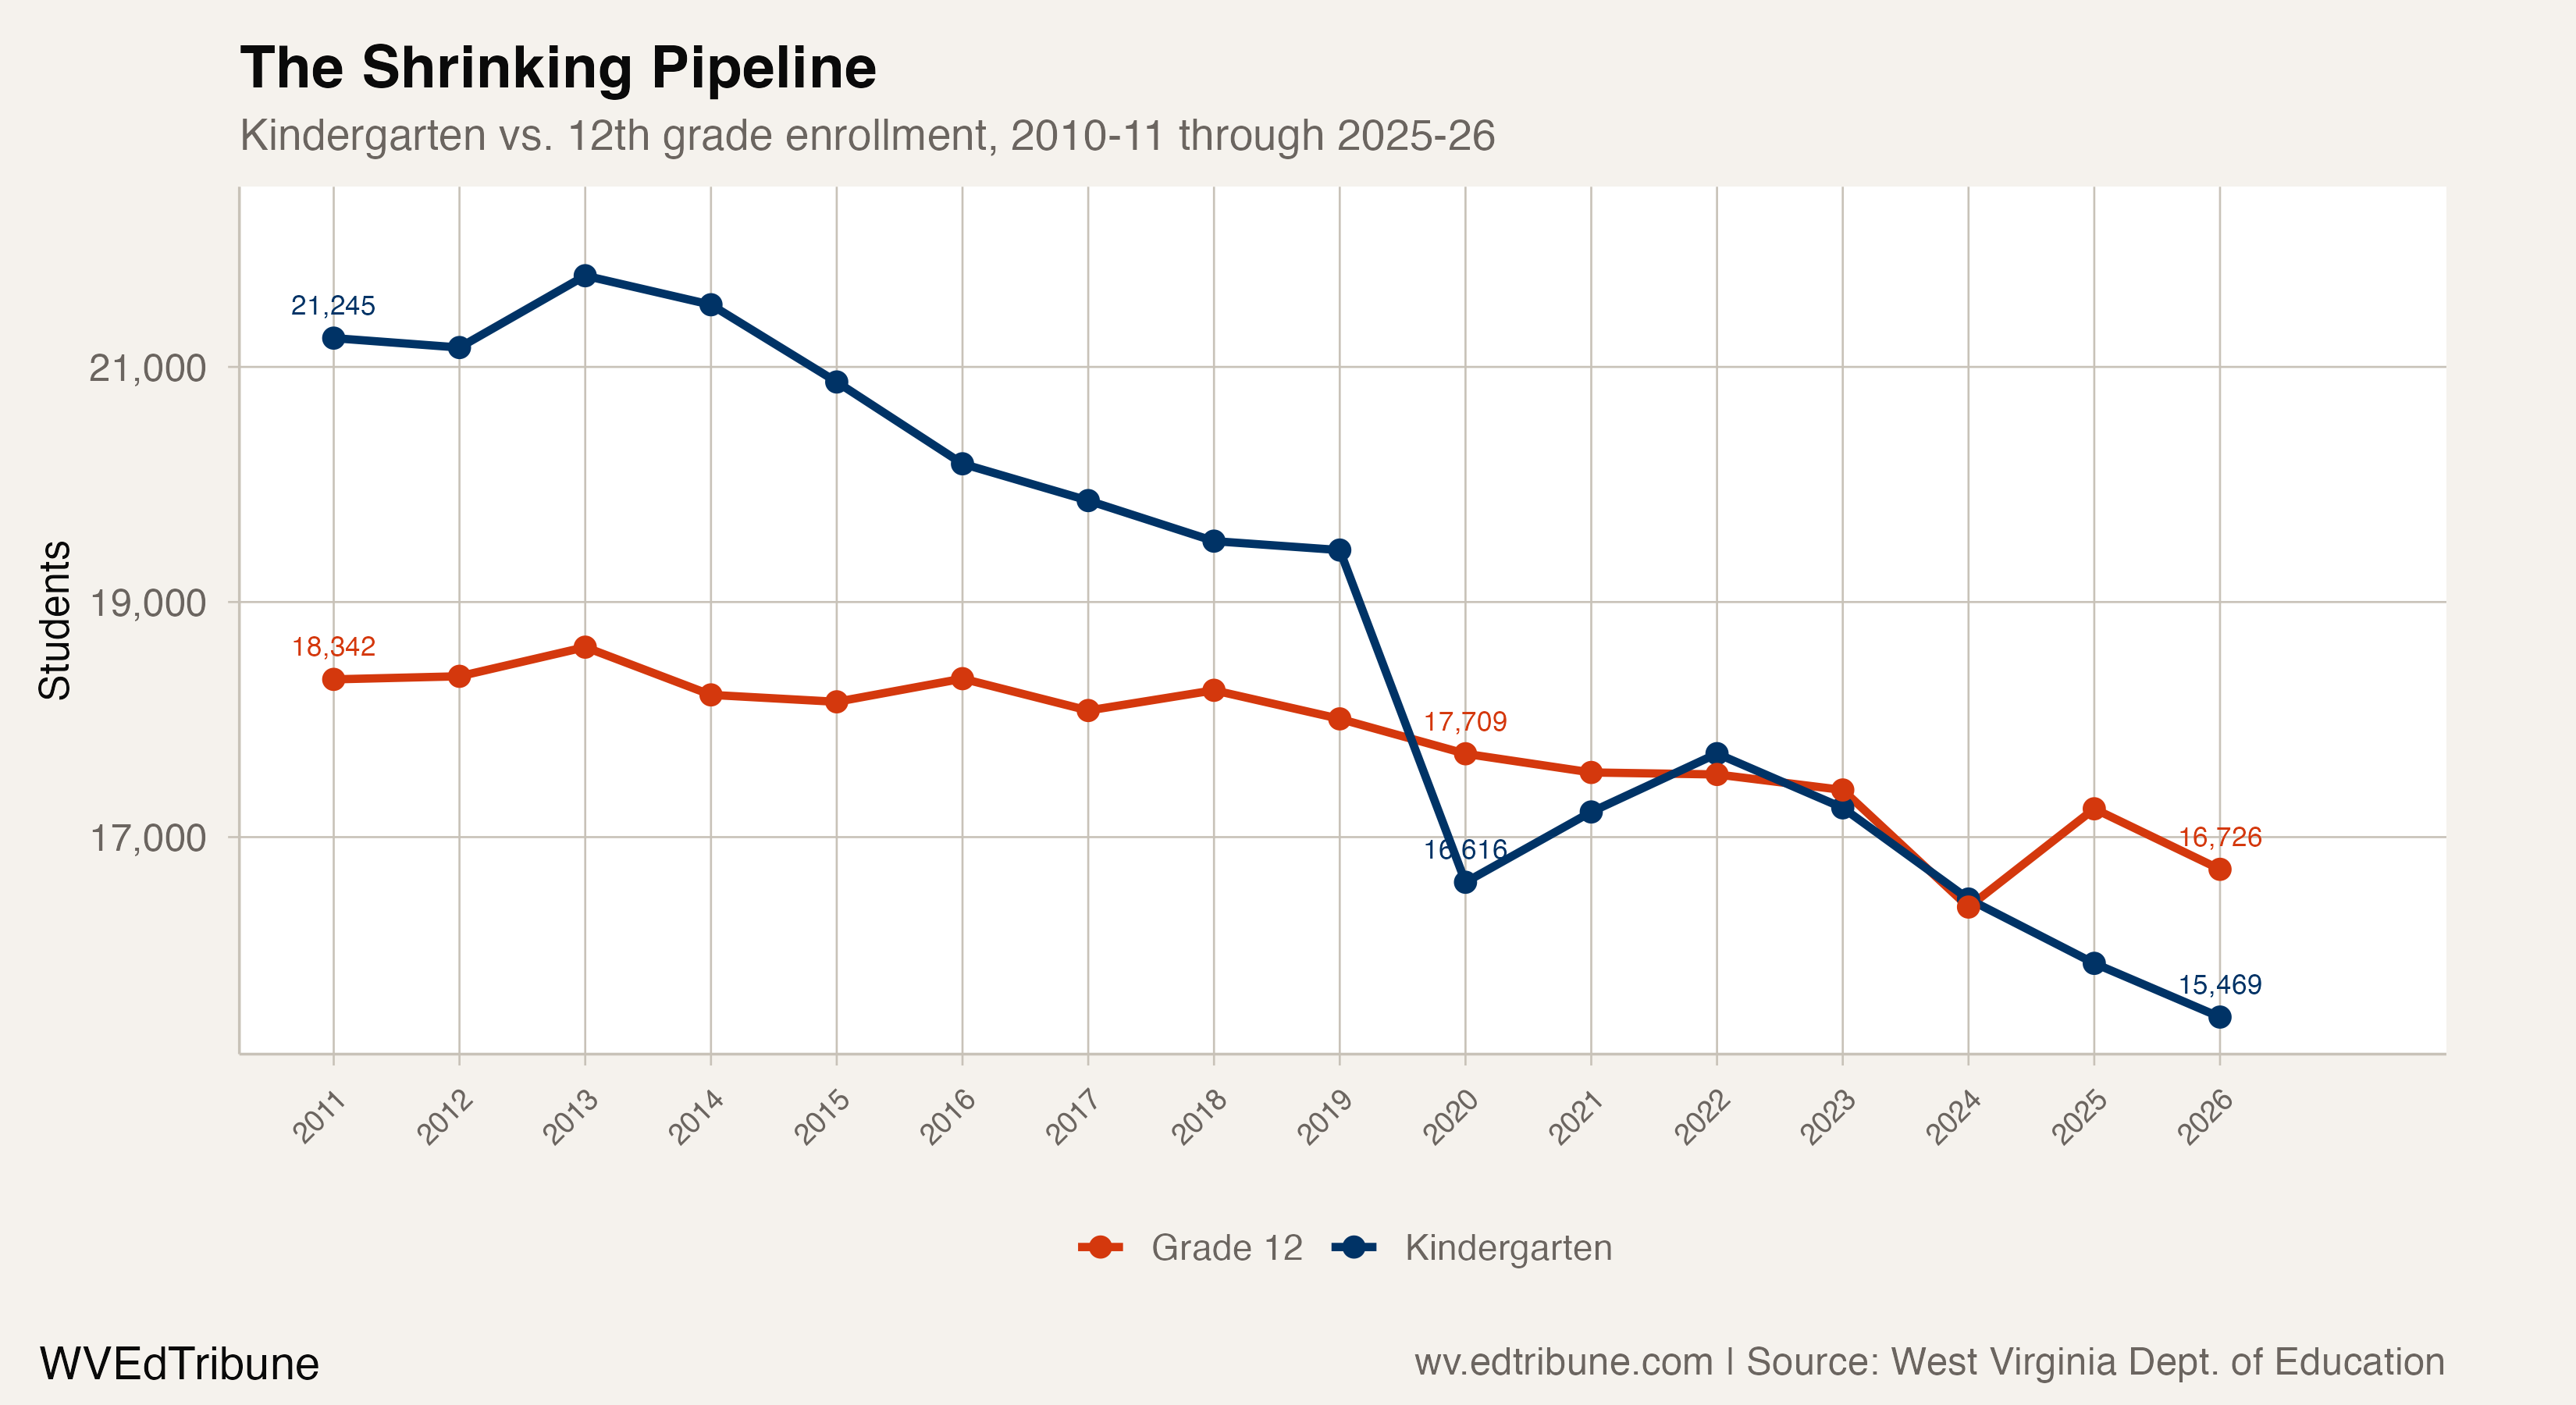
Kindergarten enrollment fell from 21,245 students in 2011 to 15,781 in 2026, a loss of 5,464 students, or 25.7%. Grade 12 declined more slowly, from 18,342 to 17,187, a 6.3% decrease. In 2026, grade 12 enrollment exceeded kindergarten enrollment by 1,406 students.
The same contrast appears in the middle grades. Grade 1 fell 24.8% from 2011 to 2026, and grade 6 fell 23.7%. These are same-grade comparisons, not a forecast of a single cohort’s path through school, but they show how unevenly the enrollment decline is distributed across the grade span.
Special education is a larger share of a smaller system
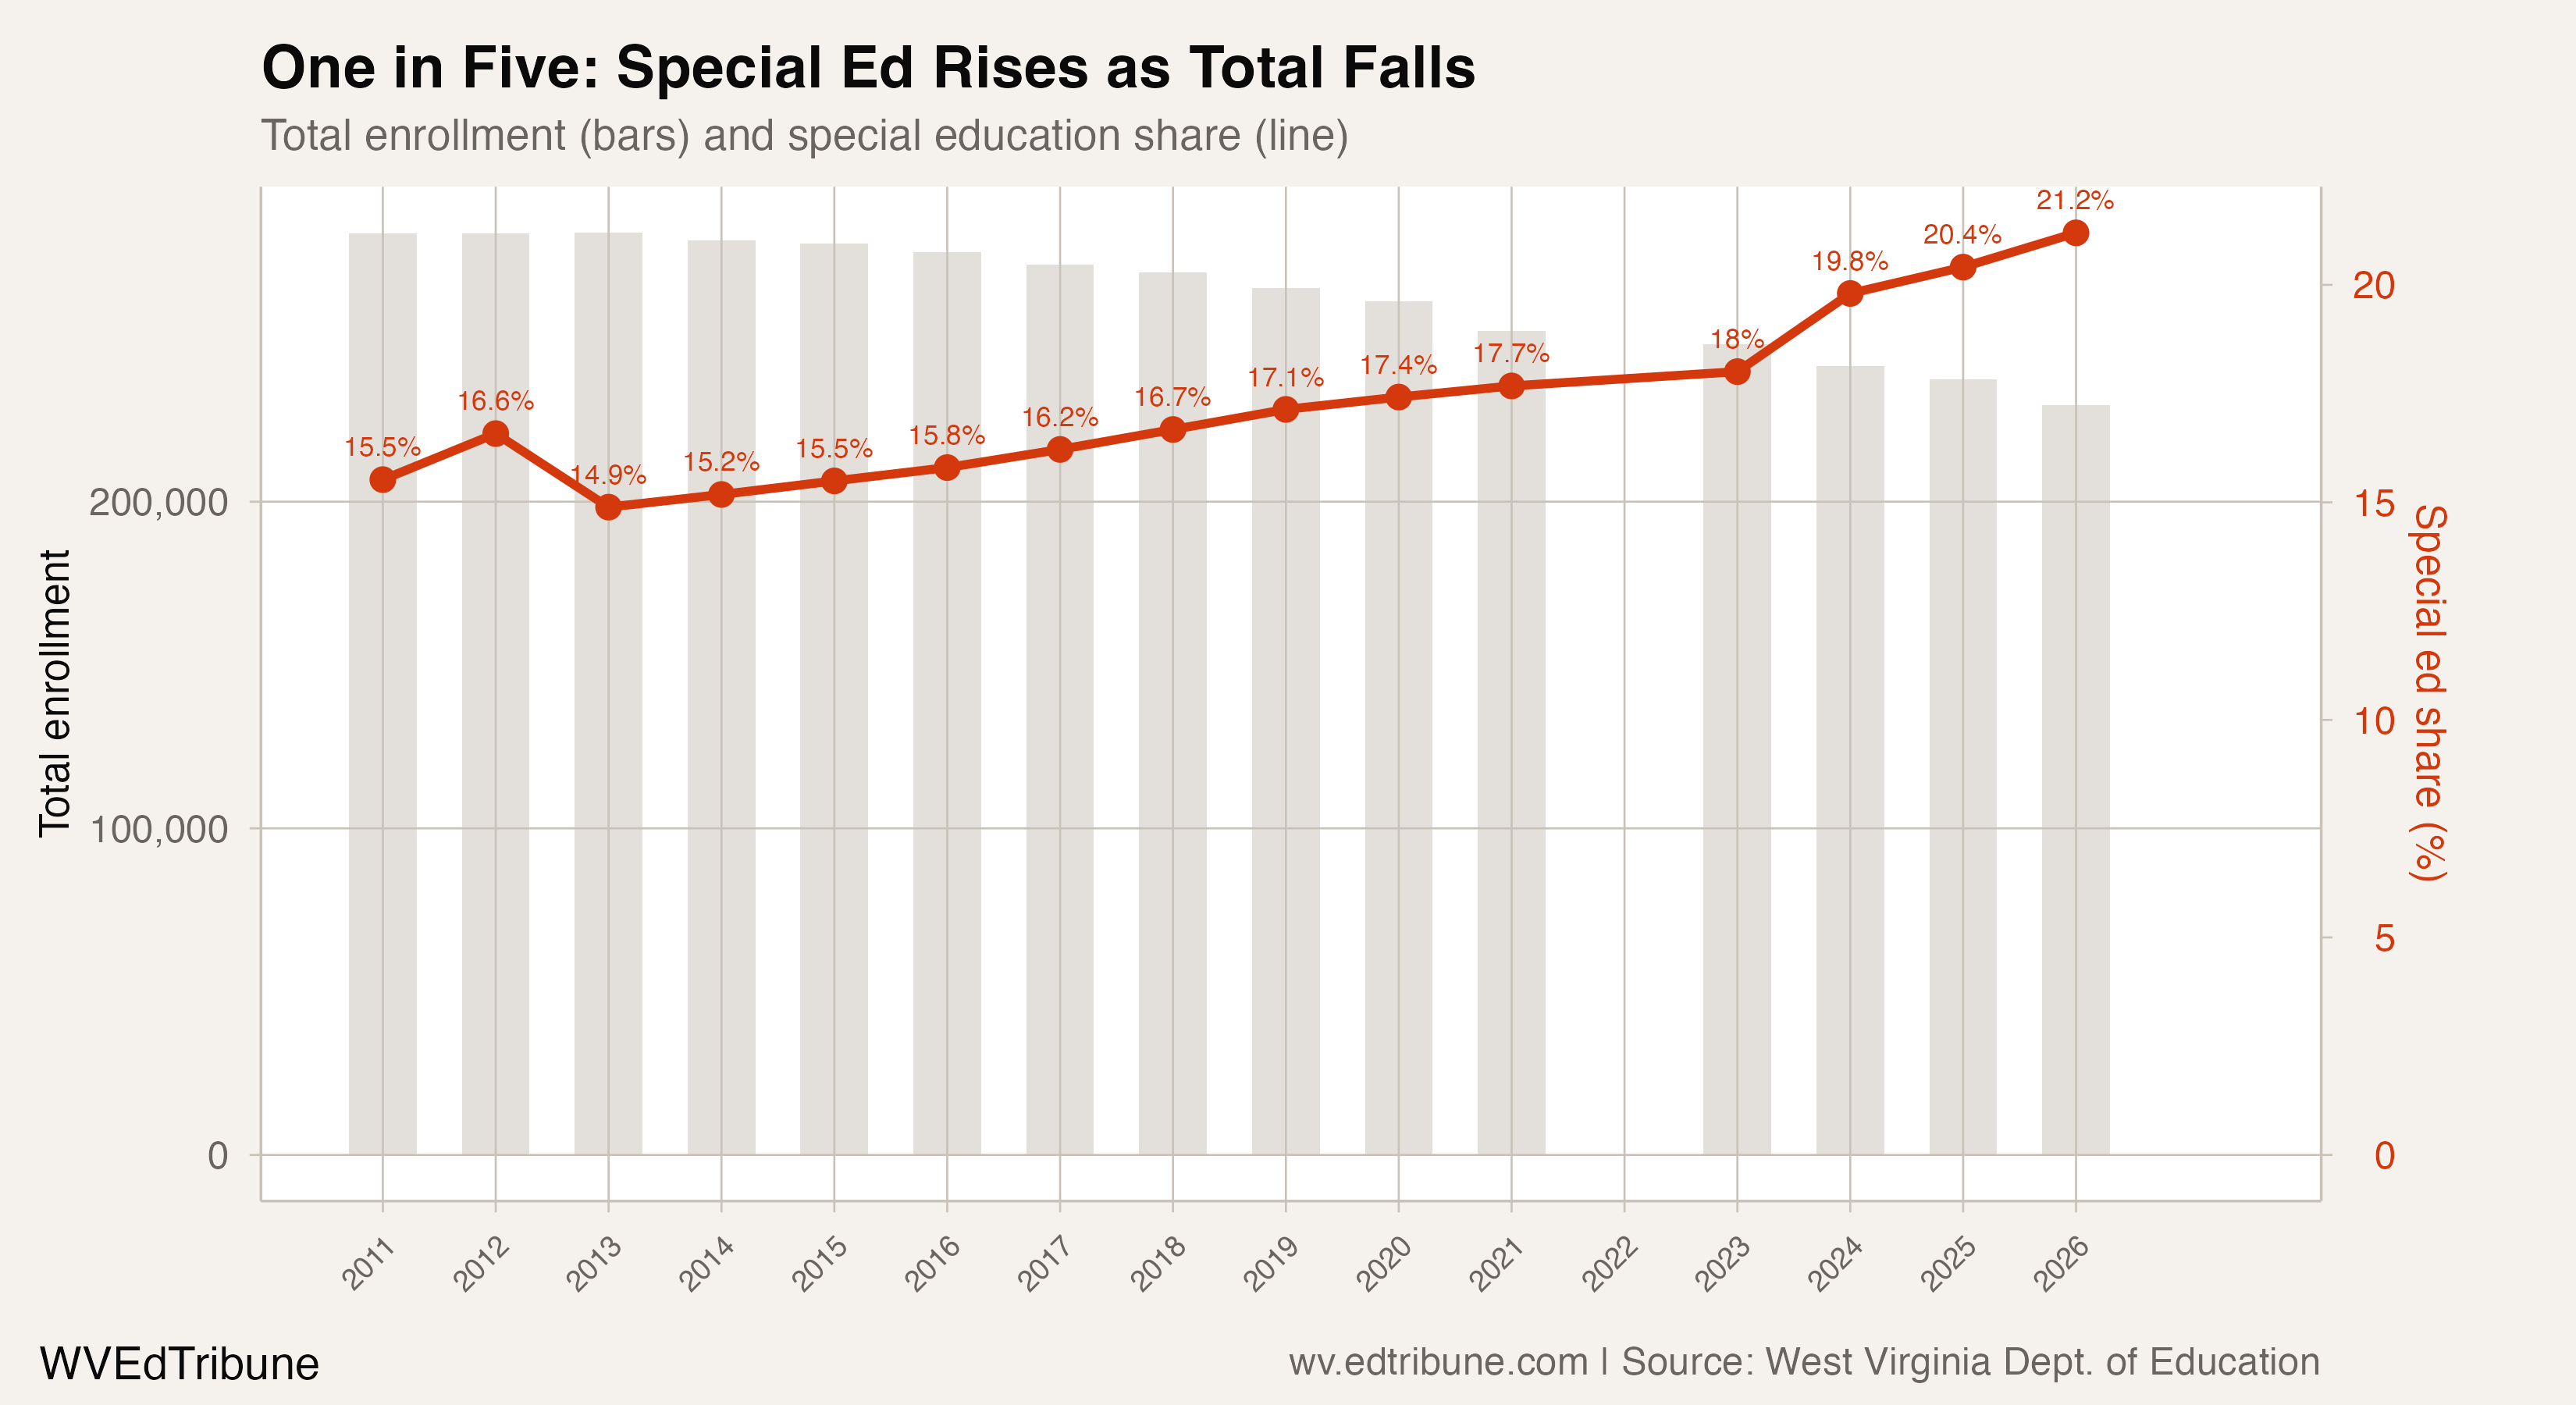
The package’s special-education series rises from 43,864 students in 2011 to 48,924 in 2026, an increase of 5,060 students. Over the same years, the special-education share of total enrollment rises from 15.5% to 20.8%.
That pattern is descriptive, not an explanation of why the counts changed. Enrollment data alone cannot distinguish improved identification from changes in student composition, service classification or participation. It does show that a lower total enrollment base can coexist with a larger special-education share.
What the enrollment panel can—and cannot—say
The direct evidence is the package-backed enrollment panel: statewide totals fall after 2013, county systems move at different rates, lower grades decline faster than grade 12, and special education makes up a larger share of the total by 2026.
Demographic change is suggestive context. The U.S. Census Bureau’s population estimates coverage describes population movement and natural change across states. School-choice policy is another suggestive context; the West Virginia Treasury’s Hope Scholarship release documents the program’s operation. Neither source lets this enrollment panel apportion the state’s losses between demographic change, transfers or other mechanisms.
The competing explanations remain unresolved in these data. The panel does not support a forward projection, a claim about school closures or budgets, or a causal estimate for any one policy. It supports a narrower conclusion: West Virginia’s public-school enrollment has declined in every annual transition after 2013, and the structure of that decline differs across counties, grades and student groups.
Detailed code that reproduces the analysis and figures in this article is available exclusively to EdTribune subscribers.
Discussion
Sign in to join the discussion.
Loading comments...