In this series: West Virginia Chronic Absenteeism.
The math looked promising in 2024. West Virginia had just posted its strongest attendance improvement since the pandemic crash, gaining 0.58 percentage points in a single year. Counties were hiring Truancy Diversion Specialists. Communities In Schools had expanded to all 55 counties. The state had joined a national pledge to cut chronic absenteeism in half within five years.
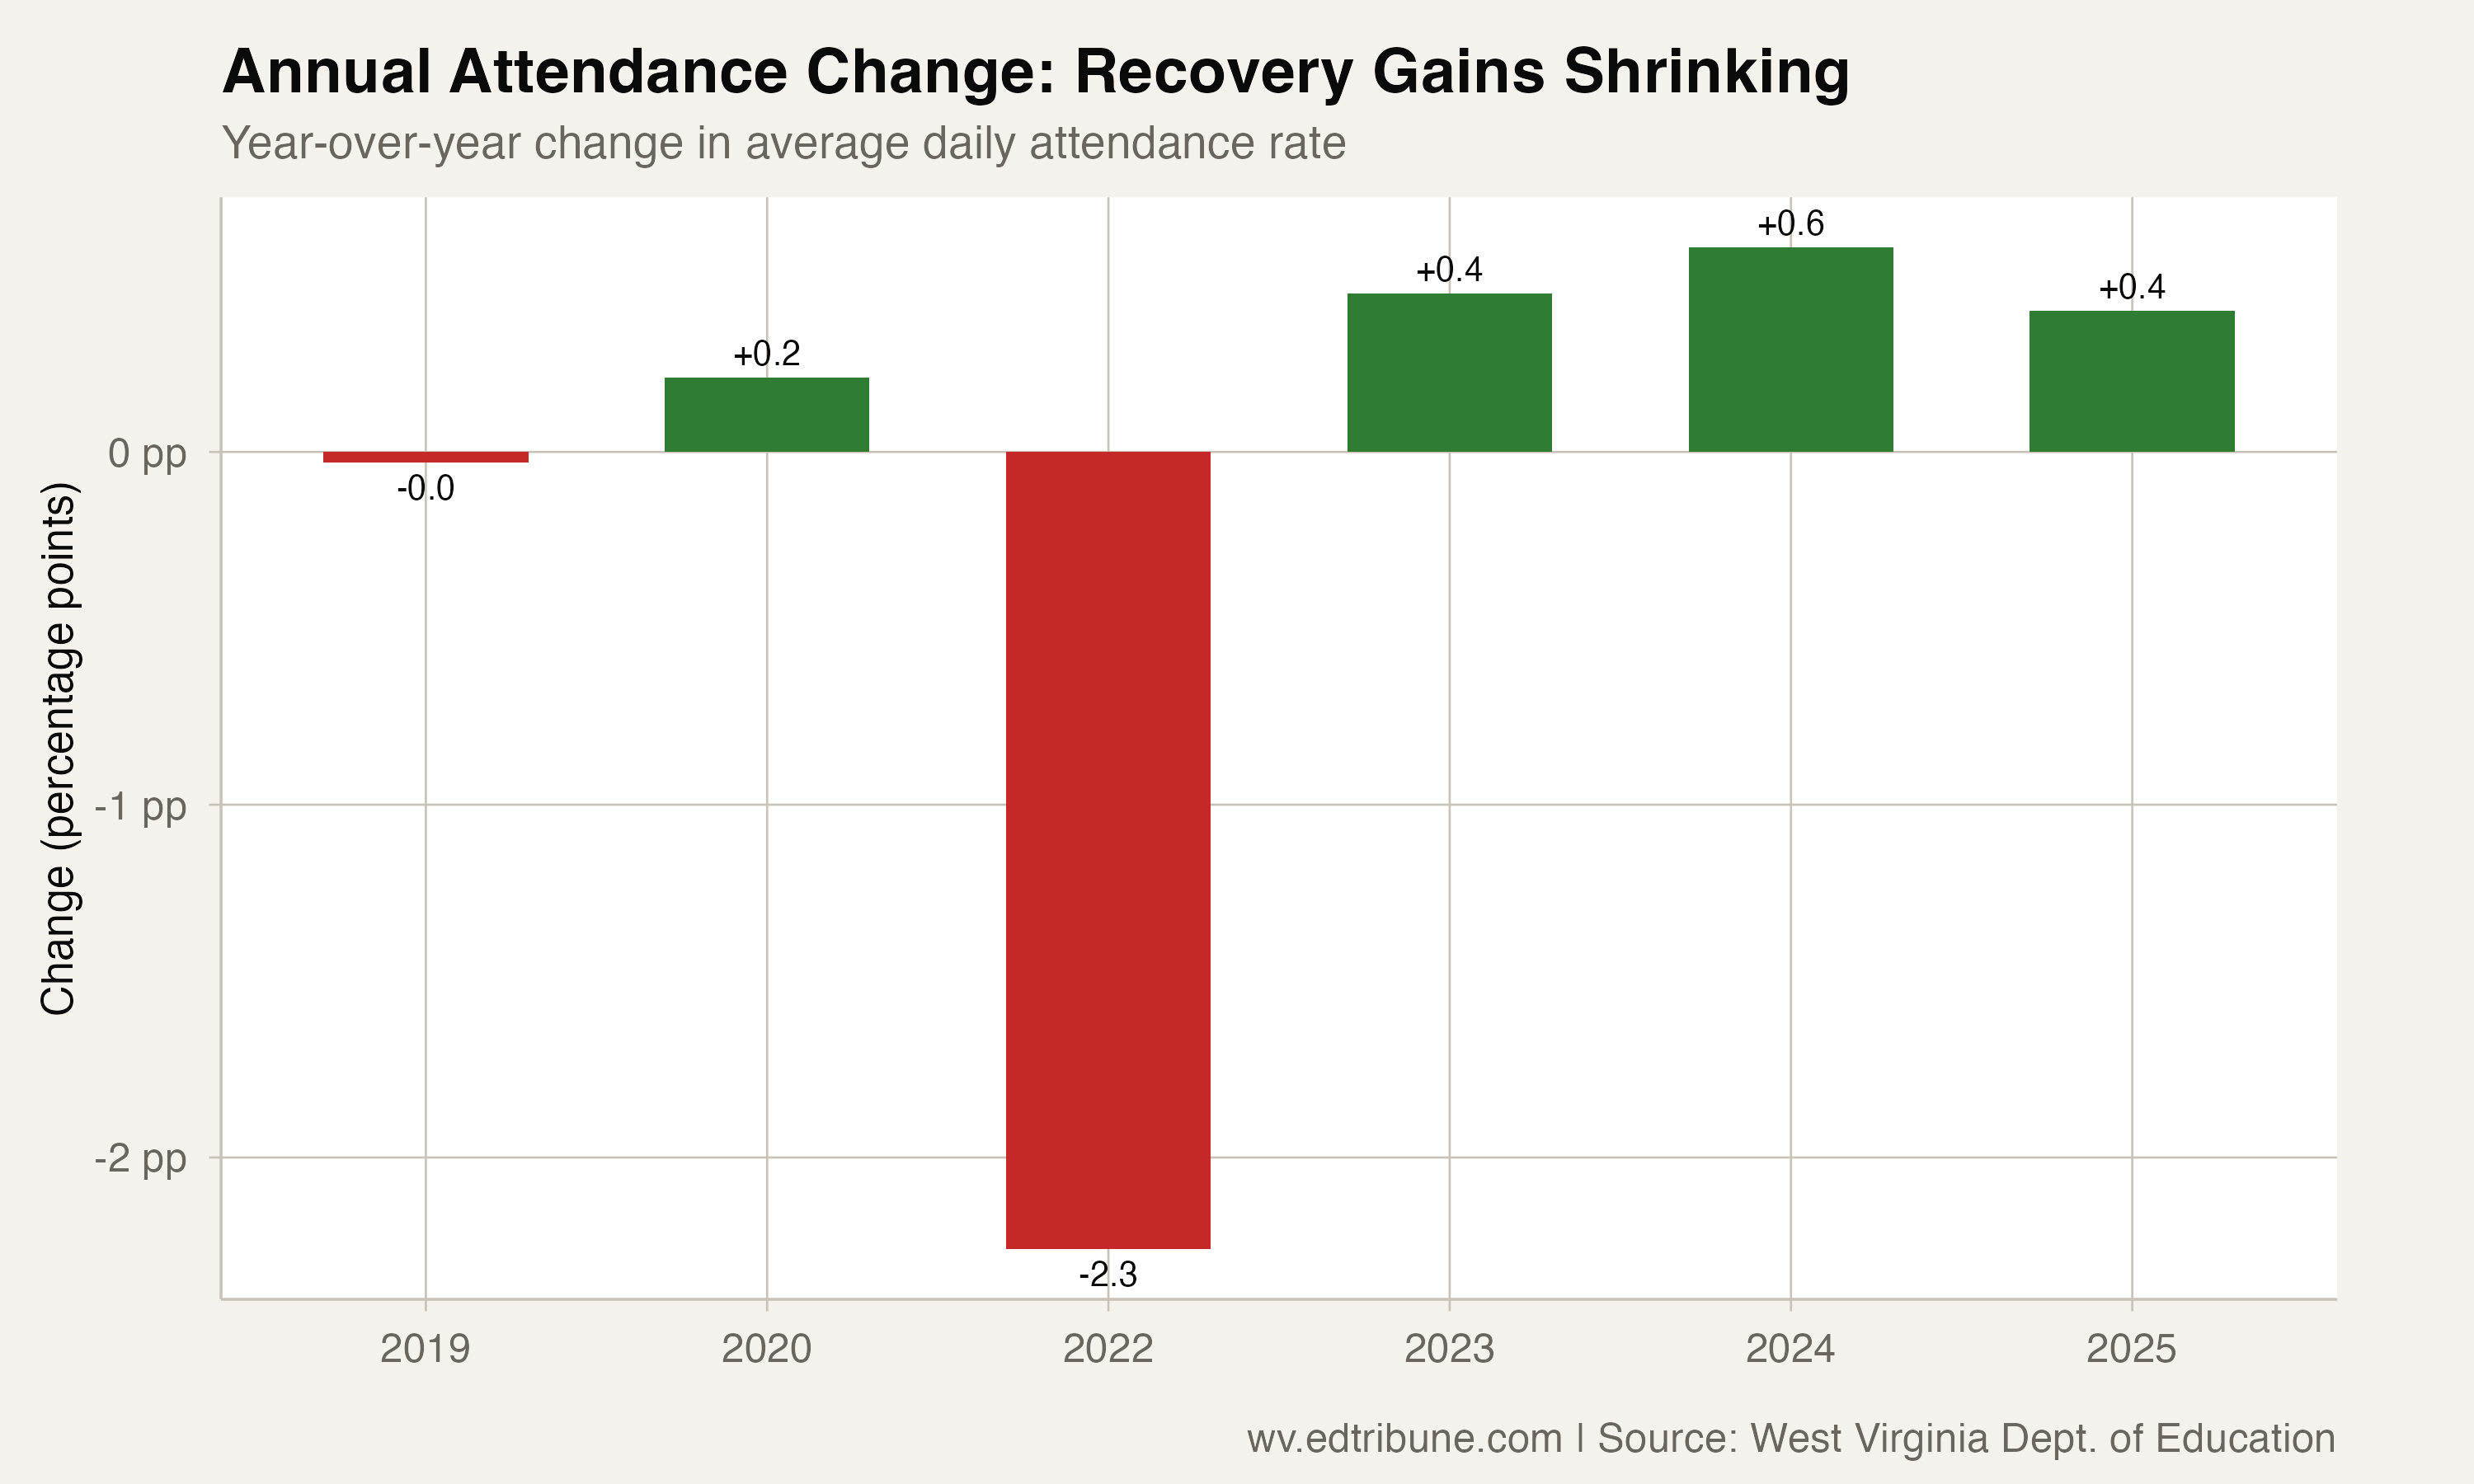
Then the 2024-25 numbers came in: a gain of 0.40 points. Smaller than the year before. Smaller, in fact, than the first year of recovery.
West Virginia's average daily attendance rate stands at 92.3% in 2024-25 — up from the 90.9% trough in 2021-22, but still 0.6 percentage points below the 92.9% the state posted before the pandemic. That 0.6-point gap translates to roughly 1.1 extra days missed per student per year, or about 231,000 lost student-days across the system.
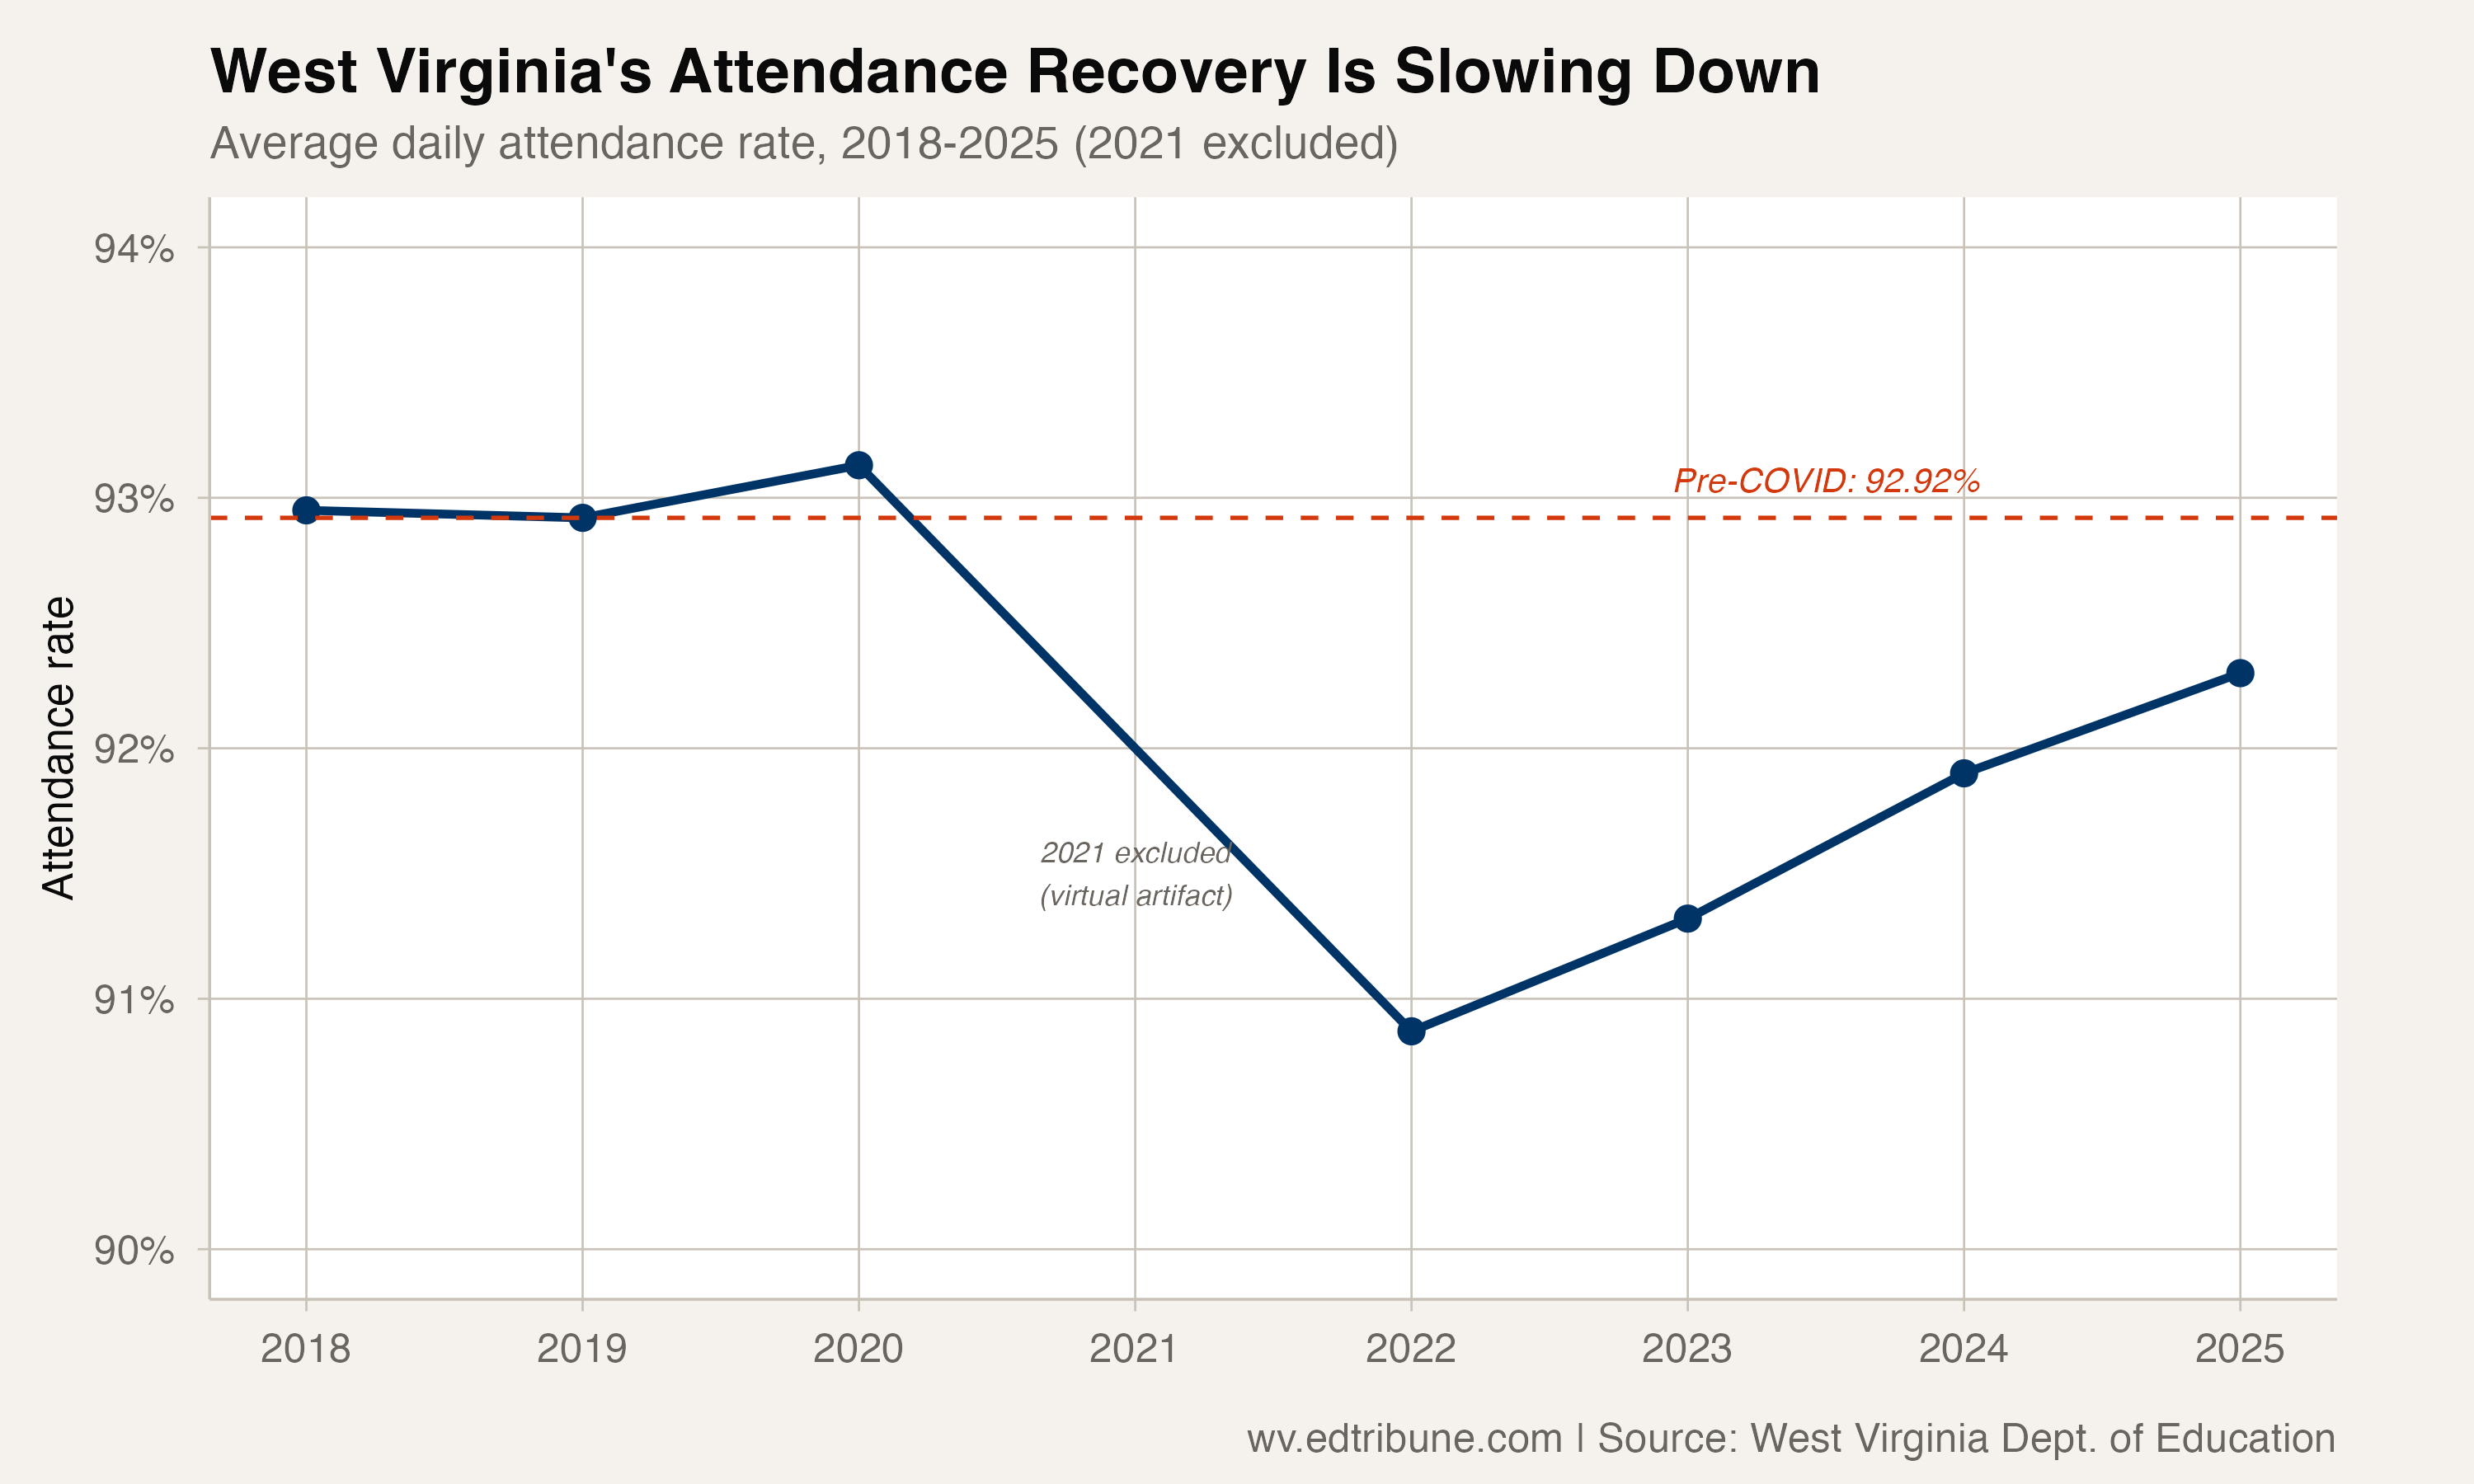
Three consecutive years of improvement — 0.45, then 0.58, then 0.40 — have recovered 70% of the ground lost during the pandemic. But the trajectory is bending. Each year's gain has been roughly proportional to the remaining gap, the kind of asymptotic curve that suggests diminishing returns rather than steady progress toward a finish line.
The students who remain absent are harder to reach
The early years of recovery had structural tailwinds. Students who had been completely disengaged during remote learning returned to buildings. Families whose attendance habits had drifted during the pandemic were reachable through phone calls and home visits. The Balanced Scorecard data from the West Virginia Department of Education showed 76% of districts improving their chronic absenteeism rates, and the statewide chronic rate fell from 29% at the peak to 22.8%.
The students who remain chronically absent in 2024-25 are a different population. Parents cite anxiety, bullying, school refusal, and transportation barriers. An Education to the Top analysis found that more than 70% of students who left public schools for homeschooling were chronically absent when they departed — suggesting the most disengaged families are simply exiting the system rather than re-engaging.
West Virginia allocates state aid based on the average of net enrollment and average daily attendance. Every empty seat costs money twice: once in the formula, once in the services the district can no longer afford. The state has lost 27,186 students since 2017-18 — an 11.3% enrollment decline — and the students who remain are attending less consistently than they did before the pandemic.
A 39-county divide
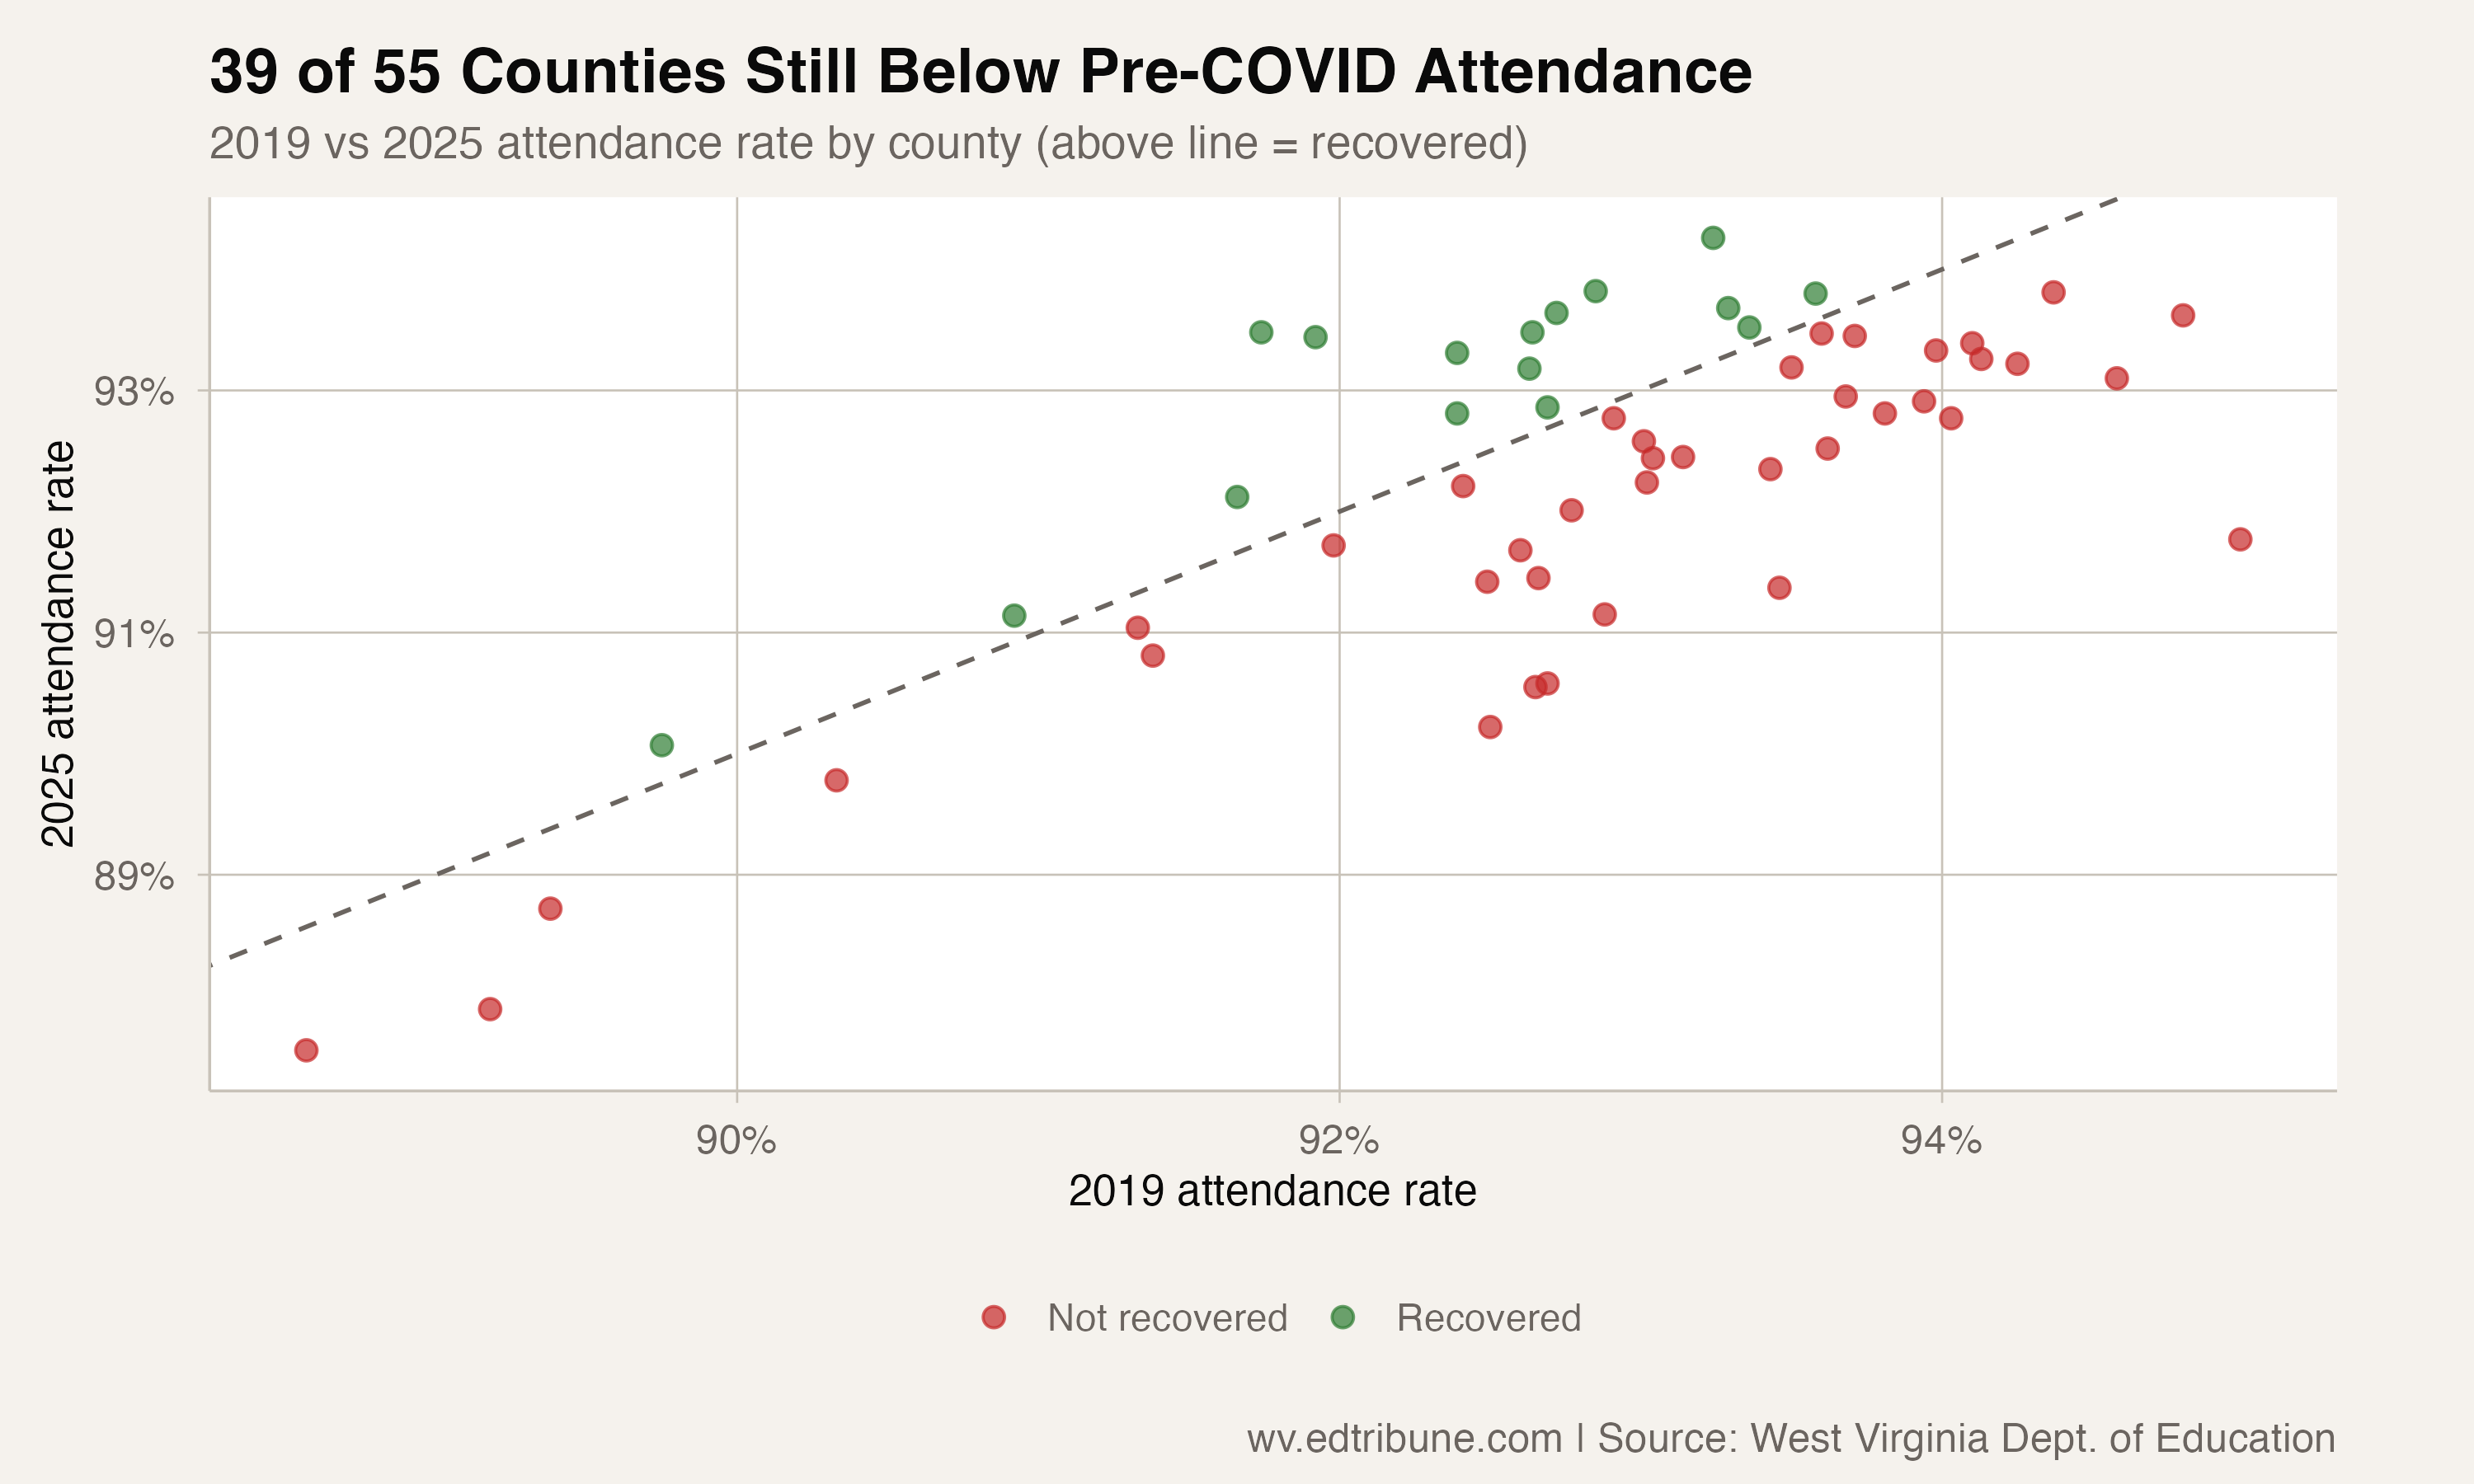
The statewide average masks a fractured landscape at the county level. Only 16 of 55 counties have returned to their pre-COVID attendance rates. Thirty-nine remain below — and five of those are actually worse than they were at the 2021-22 trough.
Kanawha County↗ET, the state's largest with 19,949 students, hit an all-time low of 91.4% in 2024-25. The capital county is one of the five that worsened since the trough. Logan County↗ET fell to 87.9%, also an all-time low, with Man Senior High School posting the state's lowest attendance at 84.7% — meaning the average student there misses roughly 27 days per year.
On the other side, Wayne County↗ET gained 5.1 percentage points since the trough, the largest recovery in the state, climbing from 86.0% to 91.0% across three consecutive years of improvement.
The vulnerable population gaps
The statewide numbers conceal sharper edges among vulnerable populations. Homeless students — now 5.5% of enrollment, up 69% since 2017-18 — attend at 90.0%, a persistent 2.3-point gap below the state average. Special education students, more than one in five statewide, attend at 91.3%, a roughly 1.0-point gap that opened during the pandemic and has not narrowed since.
Foster care students are the exception: they recovered fully from 87.8% at the trough to 92.4% in 2024-25, matching their pre-COVID level. And LEP students, a small population of 2,427, attend at 92.4% — slightly above the state average, defying national patterns where language barriers correlate with lower attendance.
What 0.6 points costs
At the current pace of recovery, West Virginia would need roughly 1.5 more years to close the remaining 0.6-point gap. But the deceleration curve suggests the math is less generous than that. If each year's improvement continues to shrink — 0.45, 0.58, 0.40, and trending downward — the state may plateau somewhere around 92.5%, permanently a few tenths of a point below where it was before the pandemic.
A few tenths of a point across 213,696 students is not a rounding error. At 92.3%, the average West Virginia student misses 13.9 days per year. At 92.9%, it was 12.8 days. That difference — one extra day per student, statewide — represents a quarter of a million instructional days that the system is not recapturing.
Senate Bill 568, signed in 2024, shifted the state from punitive truancy enforcement to a multi-tiered support model, tracking all absences rather than just unexcused ones. Twenty-seven counties now have Truancy Diversion Specialists. Whether these interventions can bend the curve back upward — or whether 92.3% is the new baseline — is the question the next two years of data will answer.
Detailed code that reproduces the analysis and figures in this article is available exclusively to EdTribune subscribers.
Discussion
Sign in to join the discussion.
Loading comments...