Correction (July 21, 2026): An earlier version reported that special education students represented 16.3% of West Virginia enrollment in 2017-18. The package-derived share is 16.4%. The article also called Wayne County's 27.7% special-education share the state's highest; it is second to Lincoln County's 28.8%.
In this series: West Virginia Chronic Absenteeism.
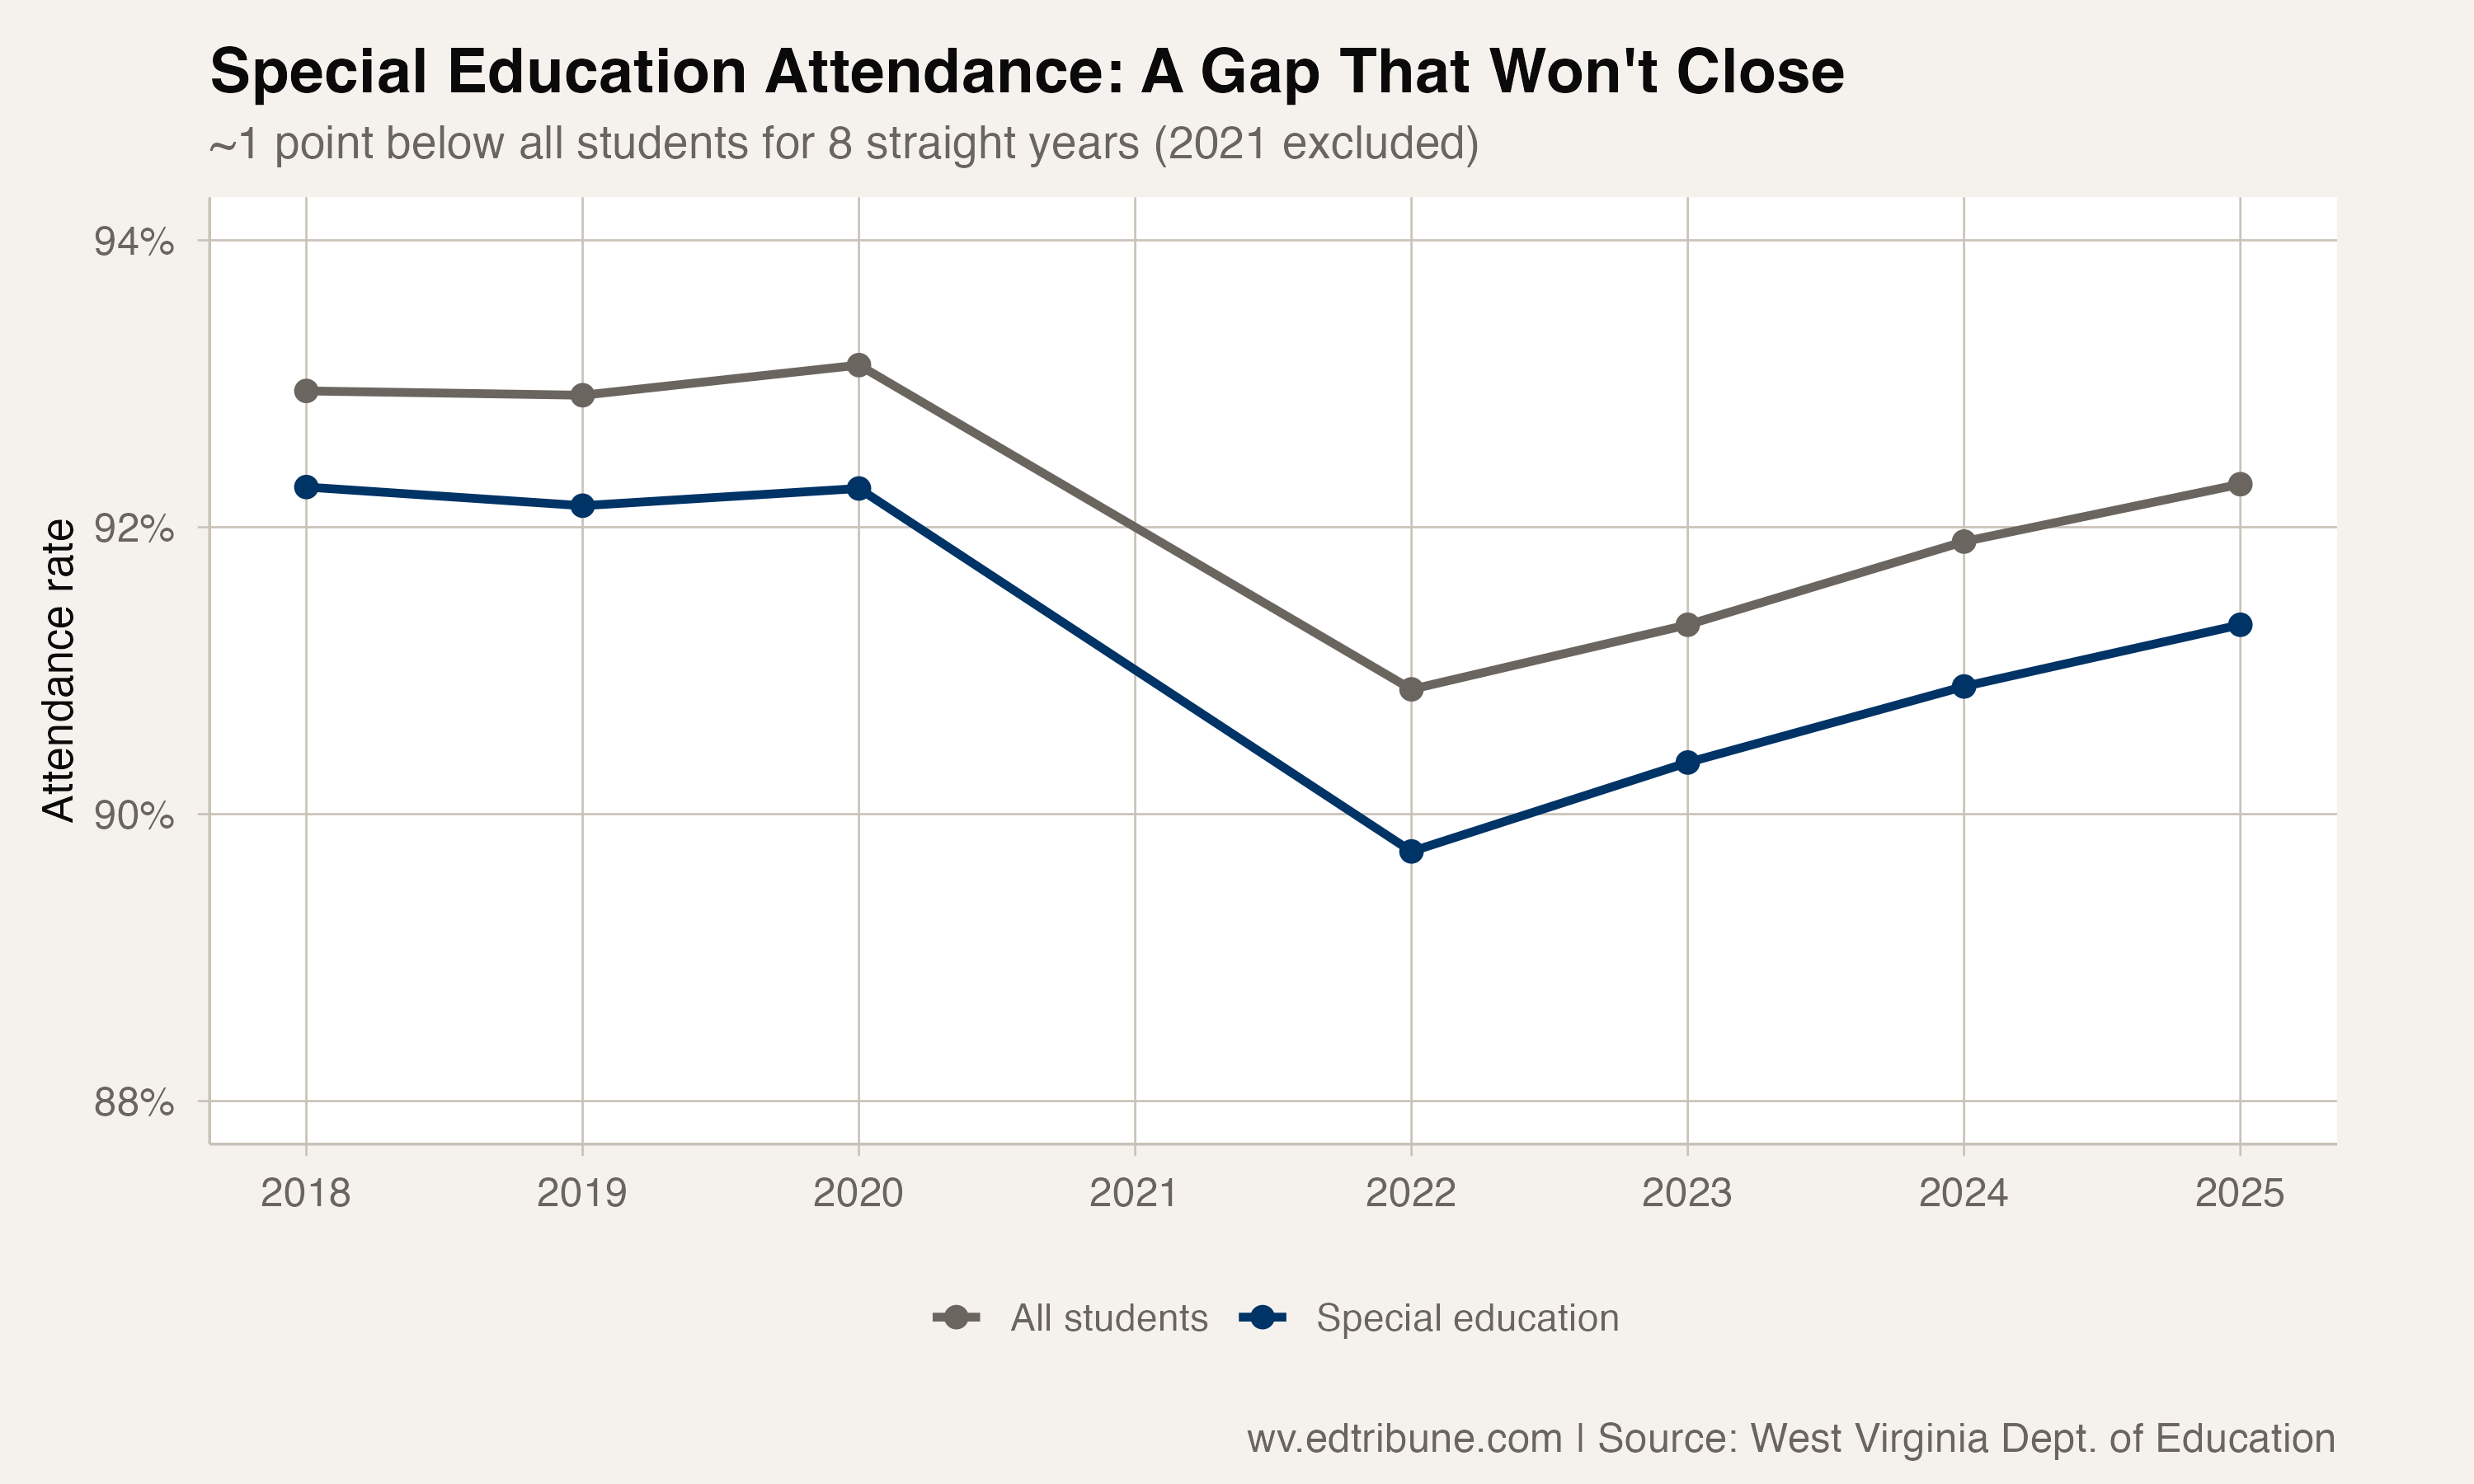
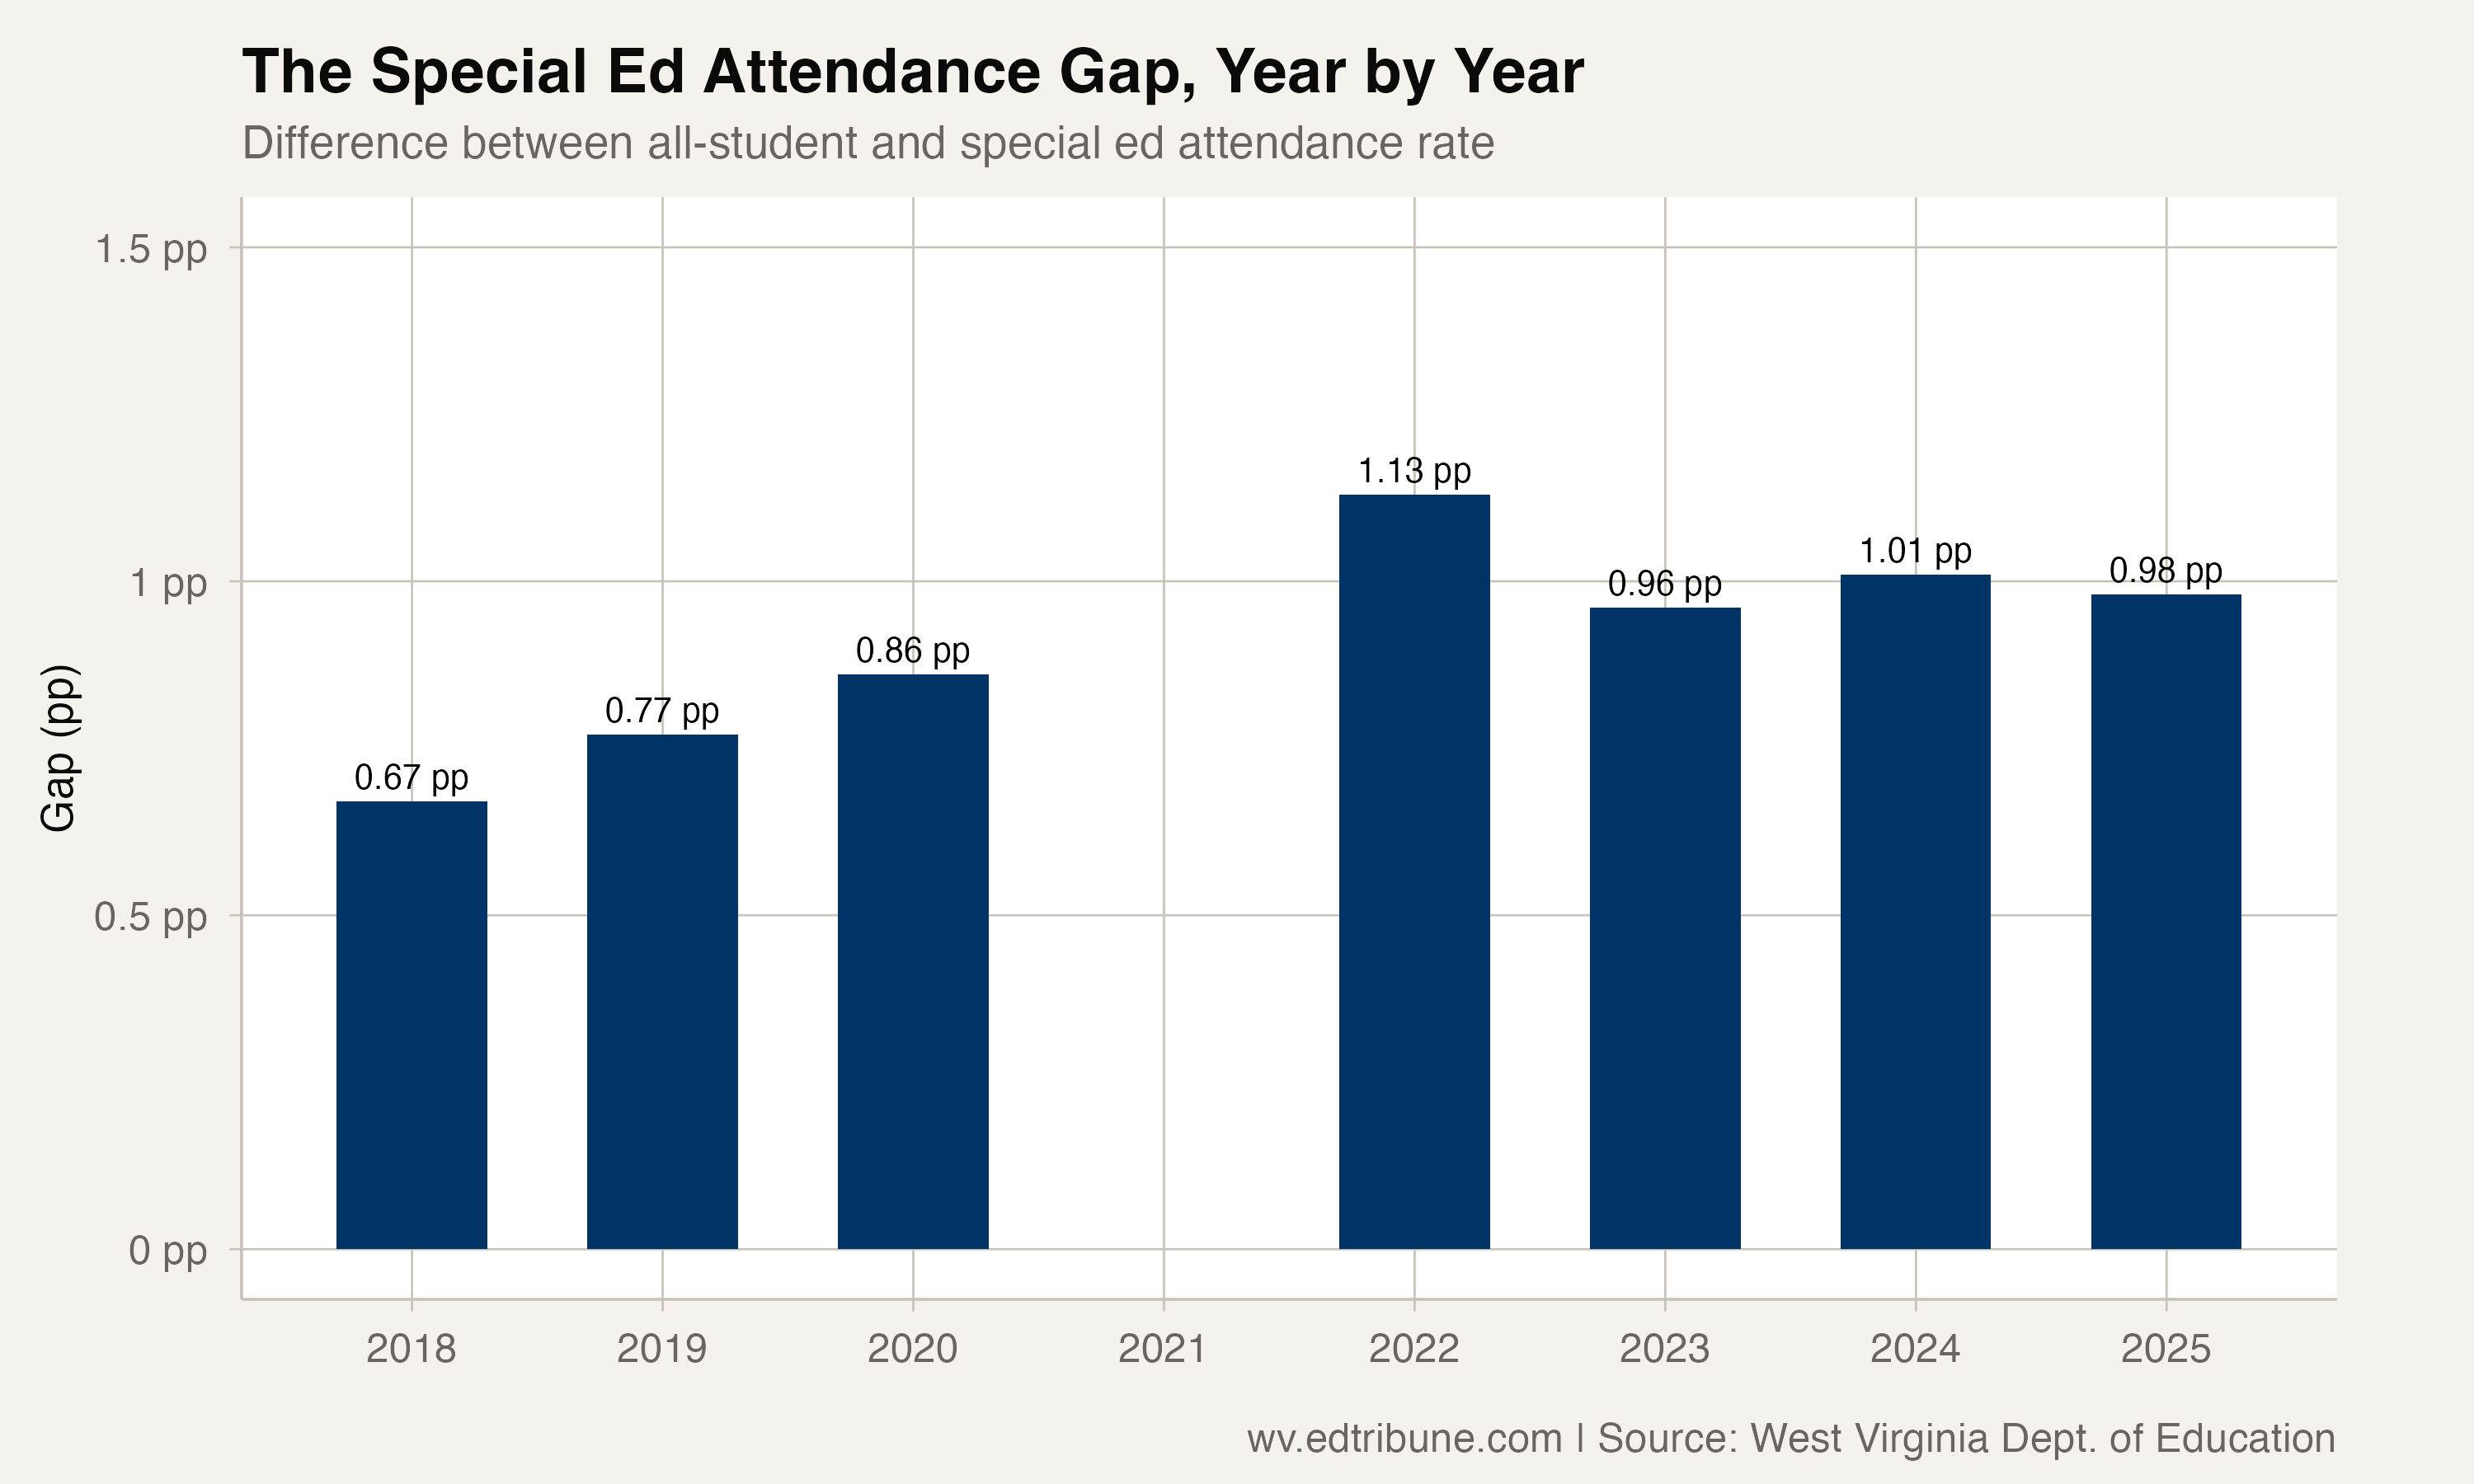
In 2017-18, special education students in West Virginia attended at 92.3%, compared to 93.0% for all students — a gap of 0.7 percentage points. Seven years later, special education students attend at 91.3% and all students at 92.3% — a gap of 1.0 points.
The gap did not form during the pandemic. It did not widen dramatically. It simply exists, year after year, in the narrow space between 0.7 and 1.1 percentage points. Both groups' reported attendance fell during the pandemic period and then recovered in nearly parallel tracks. The distance between them barely changed.
A growing share of students
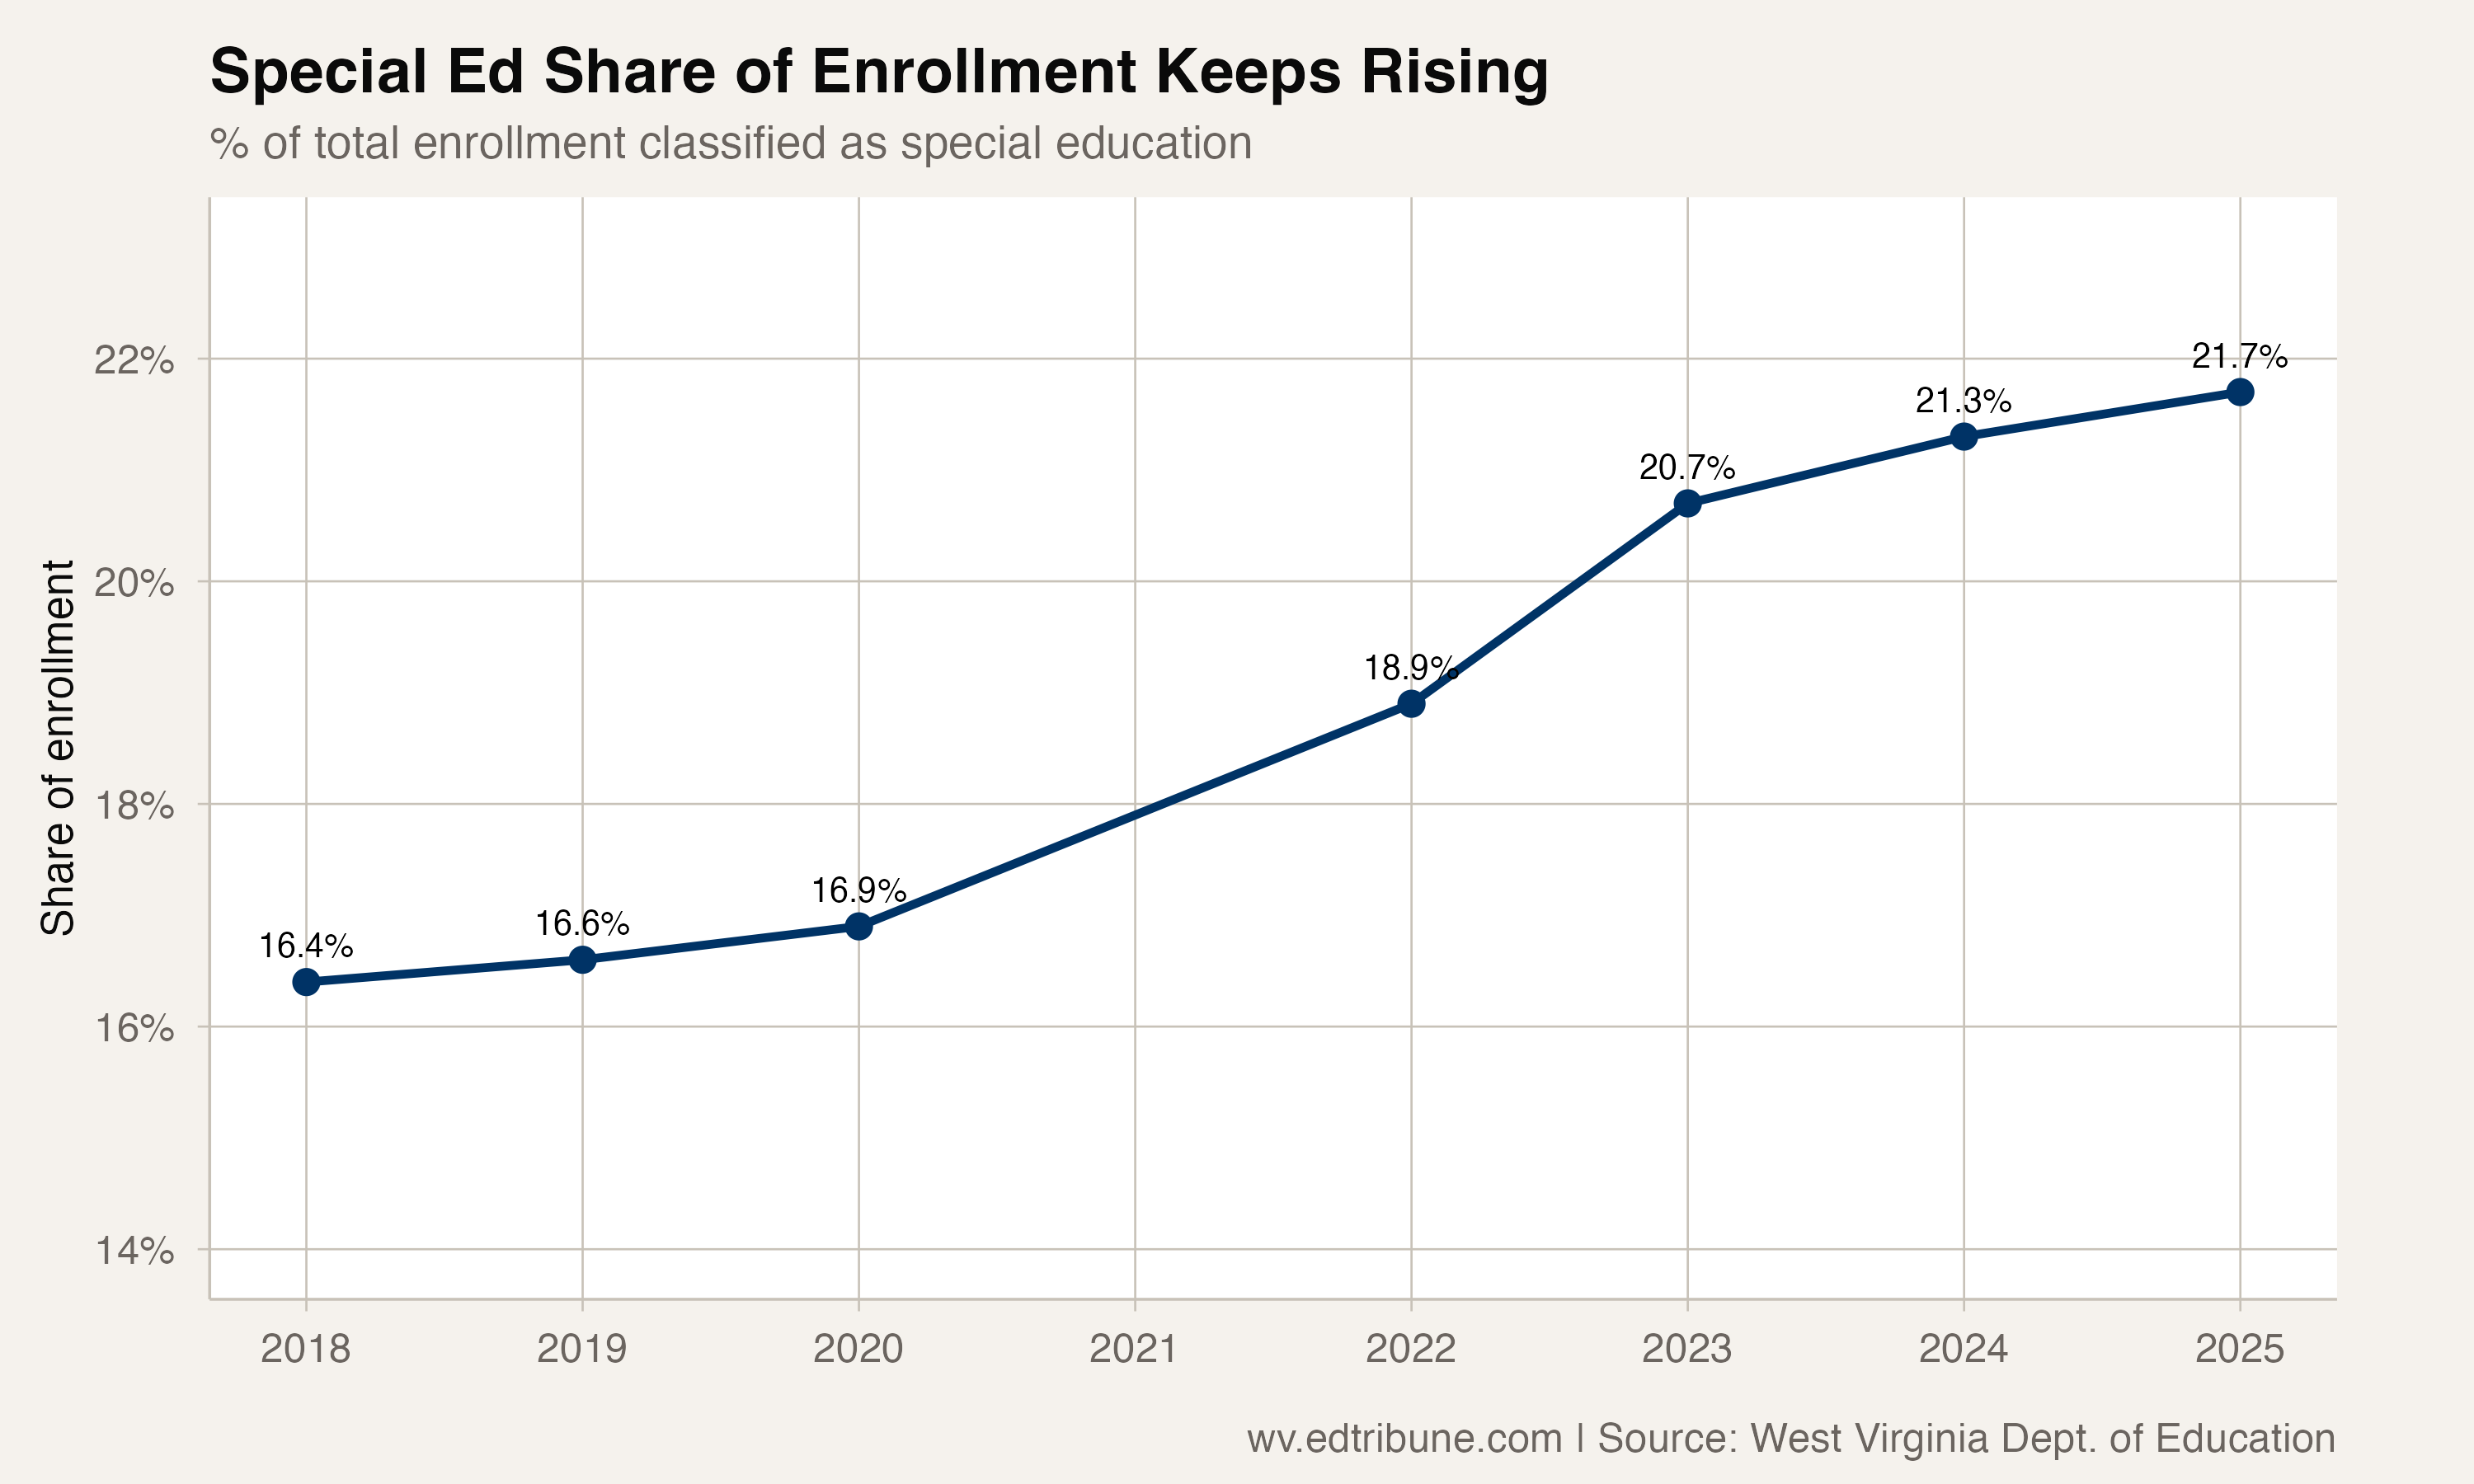
What has changed is the denominator. Special education students represented 16.4% of enrollment in 2017-18. By 2024-25, that share has grown to 21.7% — more than one in five students.
A 1.0-point gap applied to 16% of students is one thing. Applied to 22% of students, it compounds differently. The 46,287 special education students in 2024-25 collectively miss about 83,000 more days per year than they would at the all-student attendance rate.
The gap during COVID
The gap did widen slightly at the pandemic trough — from 0.8 points in 2019-20 to 1.1 points in 2021-22. Special education students fell to 89.7% while the overall rate fell to 90.9%.
The stability of the special education gap through a period that disrupted almost everything else is the story. The data does not identify the cause. It does show that the gap predated COVID, persisted through the disruption, and remained after statewide attendance began recovering.
Where the gap is largest
The statewide 1.0-point gap varies considerably across counties. Monongalia County has the largest traditional-district gap at 2.1 points (91.6% vs 93.6%). Cabell County↗ET shows a 1.5-point gap (89.7% vs 91.2%). Kanawha County↗ET shows 1.4 points (90.0% vs 91.4%).
In several counties, the gap reverses entirely. Pocahontas County's special ed students attend 0.9 points above the county average. Wirt County's gap is reversed by 0.5 points. Wayne County↗ET, where special ed students make up 27.7% of enrollment — the second-highest share among county districts — has virtually no gap (91.0% vs 91.0%).
The range — from a 2.1-point disadvantage in Monongalia to a 0.9-point advantage in Pocahontas — shows that the statewide gap is an average of highly varied local results. The aggregate attendance file does not identify the reasons for those differences.
What 1 point means at scale
At 91.3% attendance over a 180-day school year, the average special education student misses 15.7 days. At the all-student rate of 92.3%, the average student misses 13.9 days. The difference is 1.8 additional missed days per year.
Over a 13-year K-12 career, that gap accumulates to roughly 23 additional missed days — more than a month of school.
The statewide improvement from 90.9% to 92.3% brought special education along — from 89.7% to 91.3% — but the distance between the lines barely changed. West Virginia's recovery has raised both rates. It has not closed the gap between them.
Detailed code that reproduces the analysis and figures in this article is available exclusively to EdTribune subscribers.
Discussion
Sign in to join the discussion.
Loading comments...