In this series: West Virginia Chronic Absenteeism.
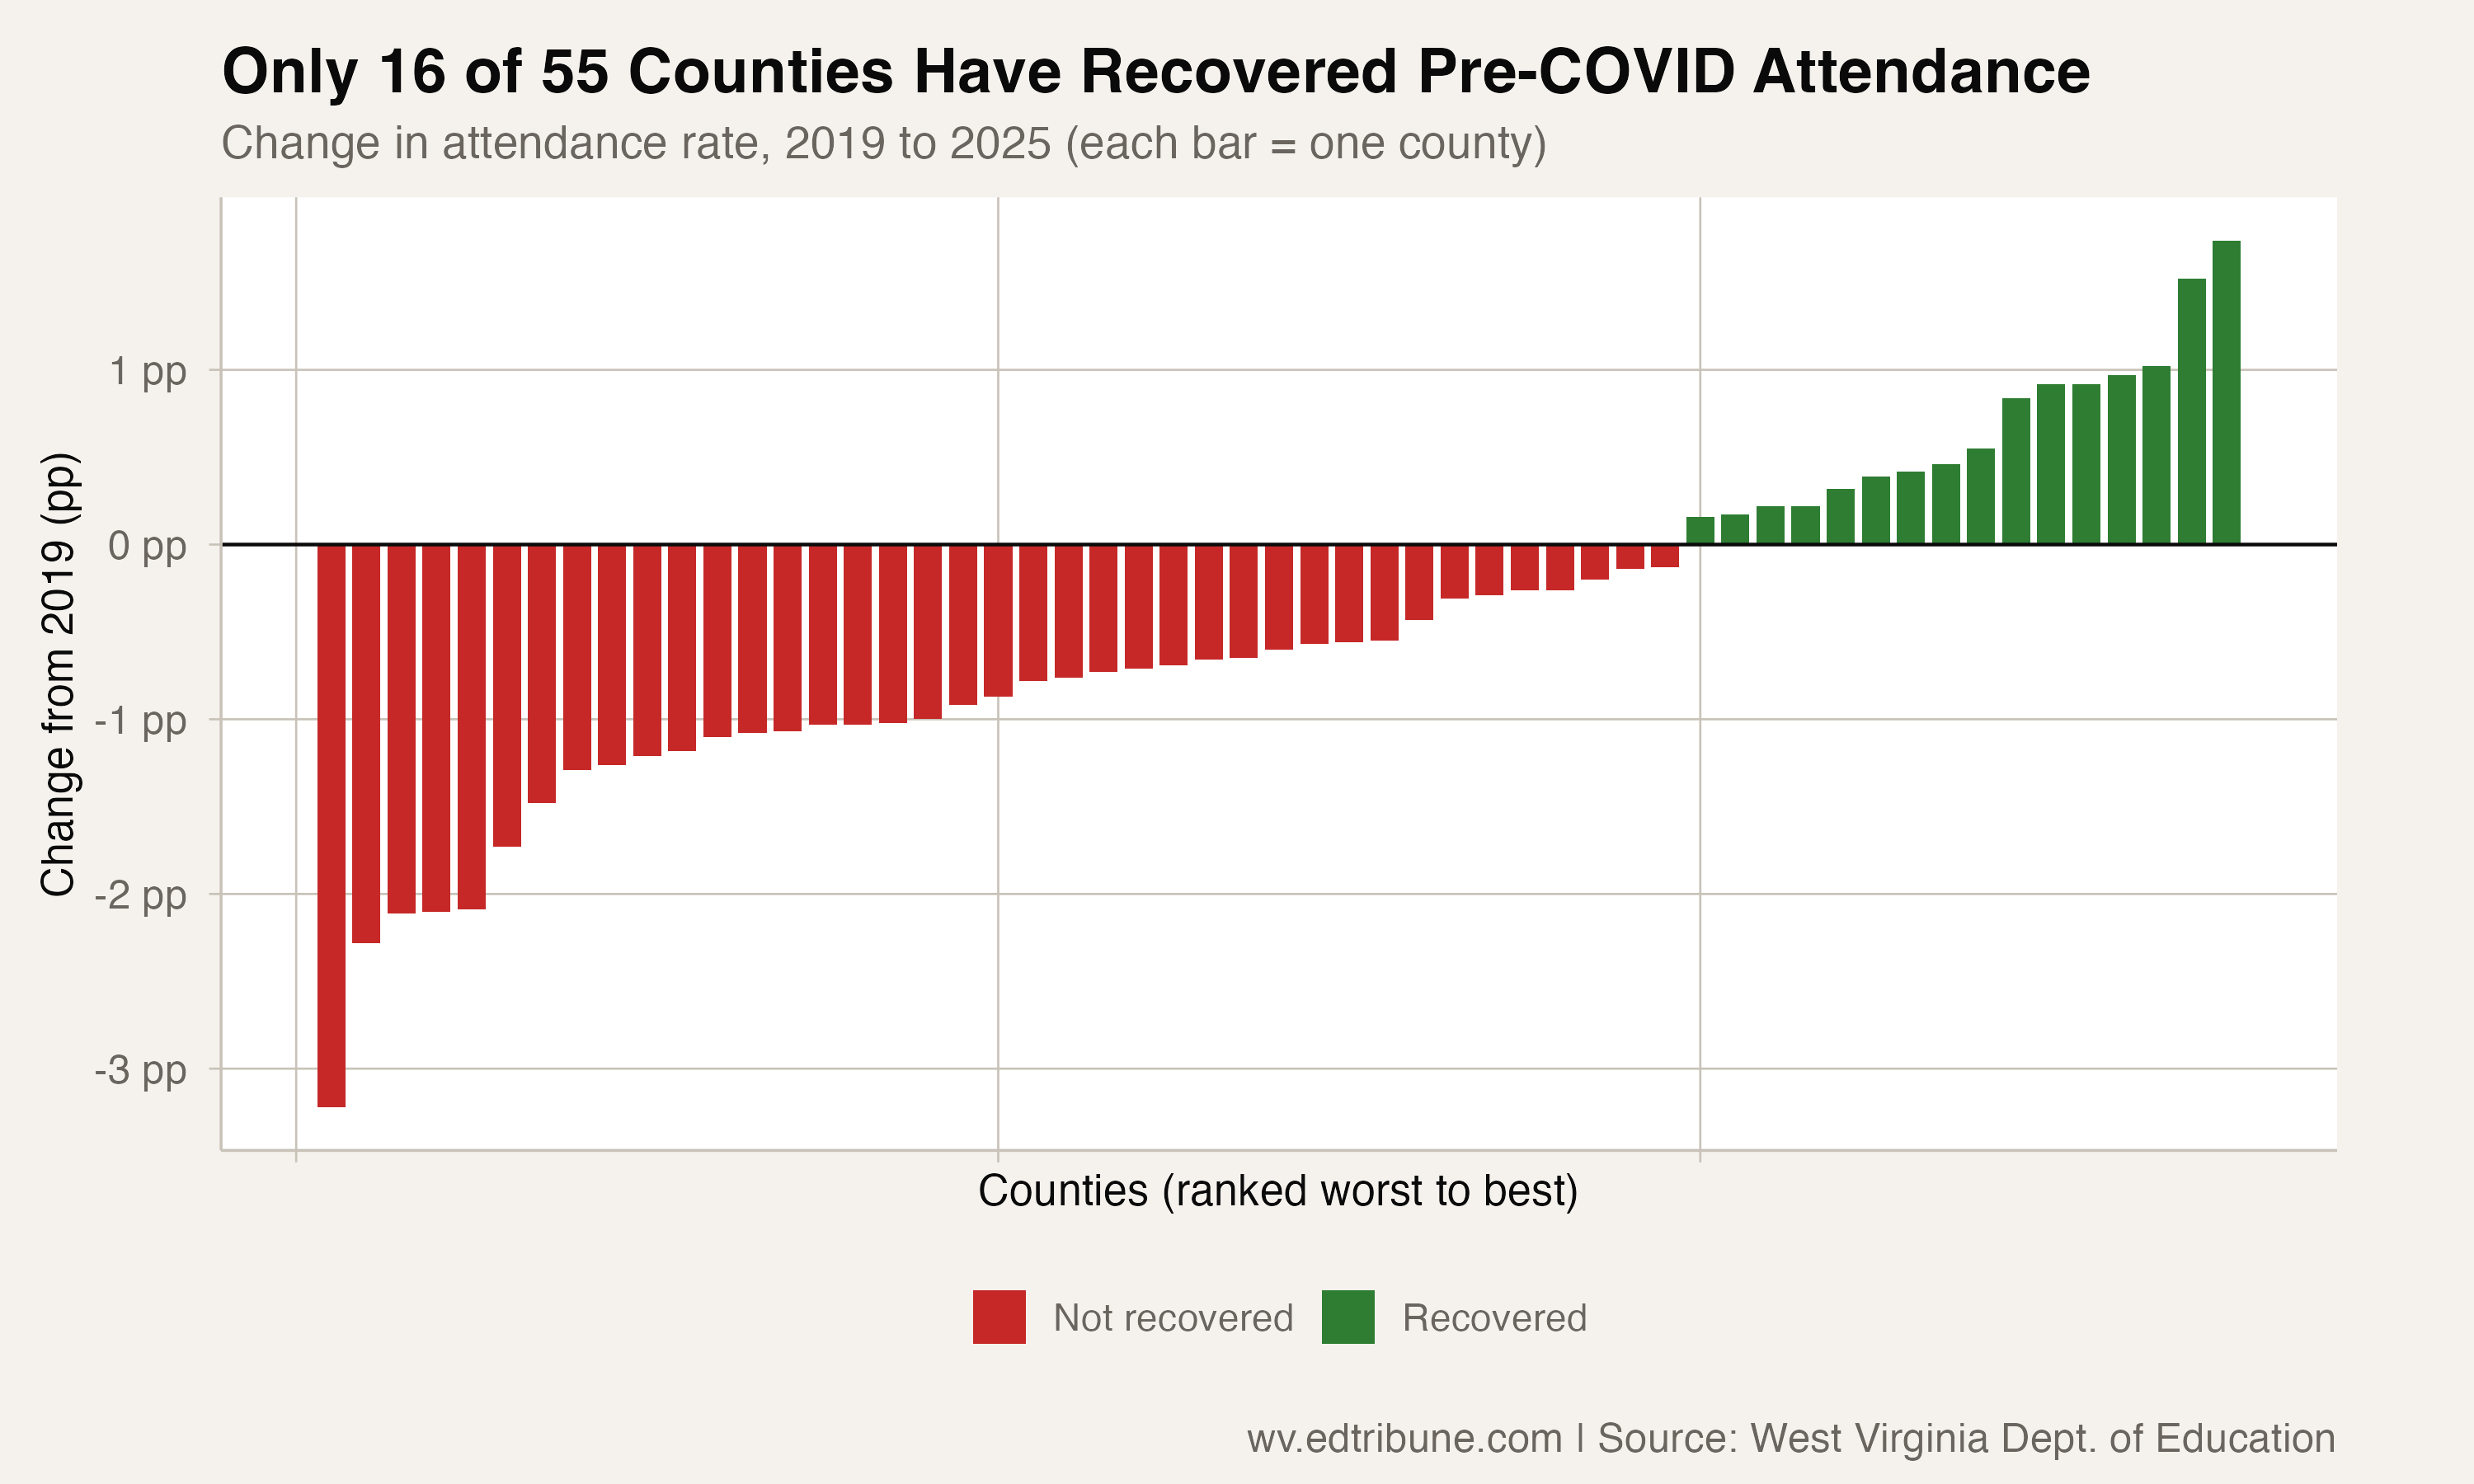
Tucker County↗ET added 1.74 percentage points to its attendance rate between 2018-19 and 2024-25. Morgan County↗ET lost 3.22 points over the same period. Both are small, rural, overwhelmingly white counties in the eastern part of the state. Both were hit by the same pandemic.
The divergence between them illustrates a broader pattern: West Virginia's attendance recovery is not a statewide phenomenon. It is a story of 16 counties that have reclaimed what COVID took, and 39 that have not.
The recovered
The 16 counties that have returned to or exceeded their pre-COVID attendance rates share no obvious geographic pattern. They include Tucker County in the Allegheny highlands (93.5%, up 1.7 points from 2019), Mercer County↗ET in the southern coalfields (93.4%, up 1.5 points), and Hancock County↗ET in the Northern Panhandle (94.3%, up 1.0 points). Some were strong before the pandemic and got stronger. Others, like Lincoln County (90.1%, up 0.3 points), were weak before and barely cleared the bar.
What the recovered counties have in common is persistence. Most have posted three consecutive years of improvement since the 2022 trough. Fifteen counties are on such streaks, led by Wayne County↗ET (+5.1 points since 2022), Summers County (+4.3), and Wyoming County (+3.6). These are not the counties you would predict from a map of wealth or demographics. Wayne and Wyoming are among the state's poorest, and whatever is driving recovery, it is not affluence.
The stuck
Thirty-nine counties remain below their pre-COVID attendance rates. The median deficit is 0.9 percentage points, small enough to sound insignificant but large enough to represent thousands of additional missed days per county per year.
The worst-off counties show gaps that are hard to explain by pandemic disruption alone. Morgan County's 3.2-point drop is the largest in the state, from 95.0% in 2019 to 91.8% in 2025. Pocahontas County↗ET fell 2.3 points, Brooke County↗ET 2.1 points. Kanawha County↗ET, the state's largest district at 19,949 students, dropped 2.1 points to 91.4%.
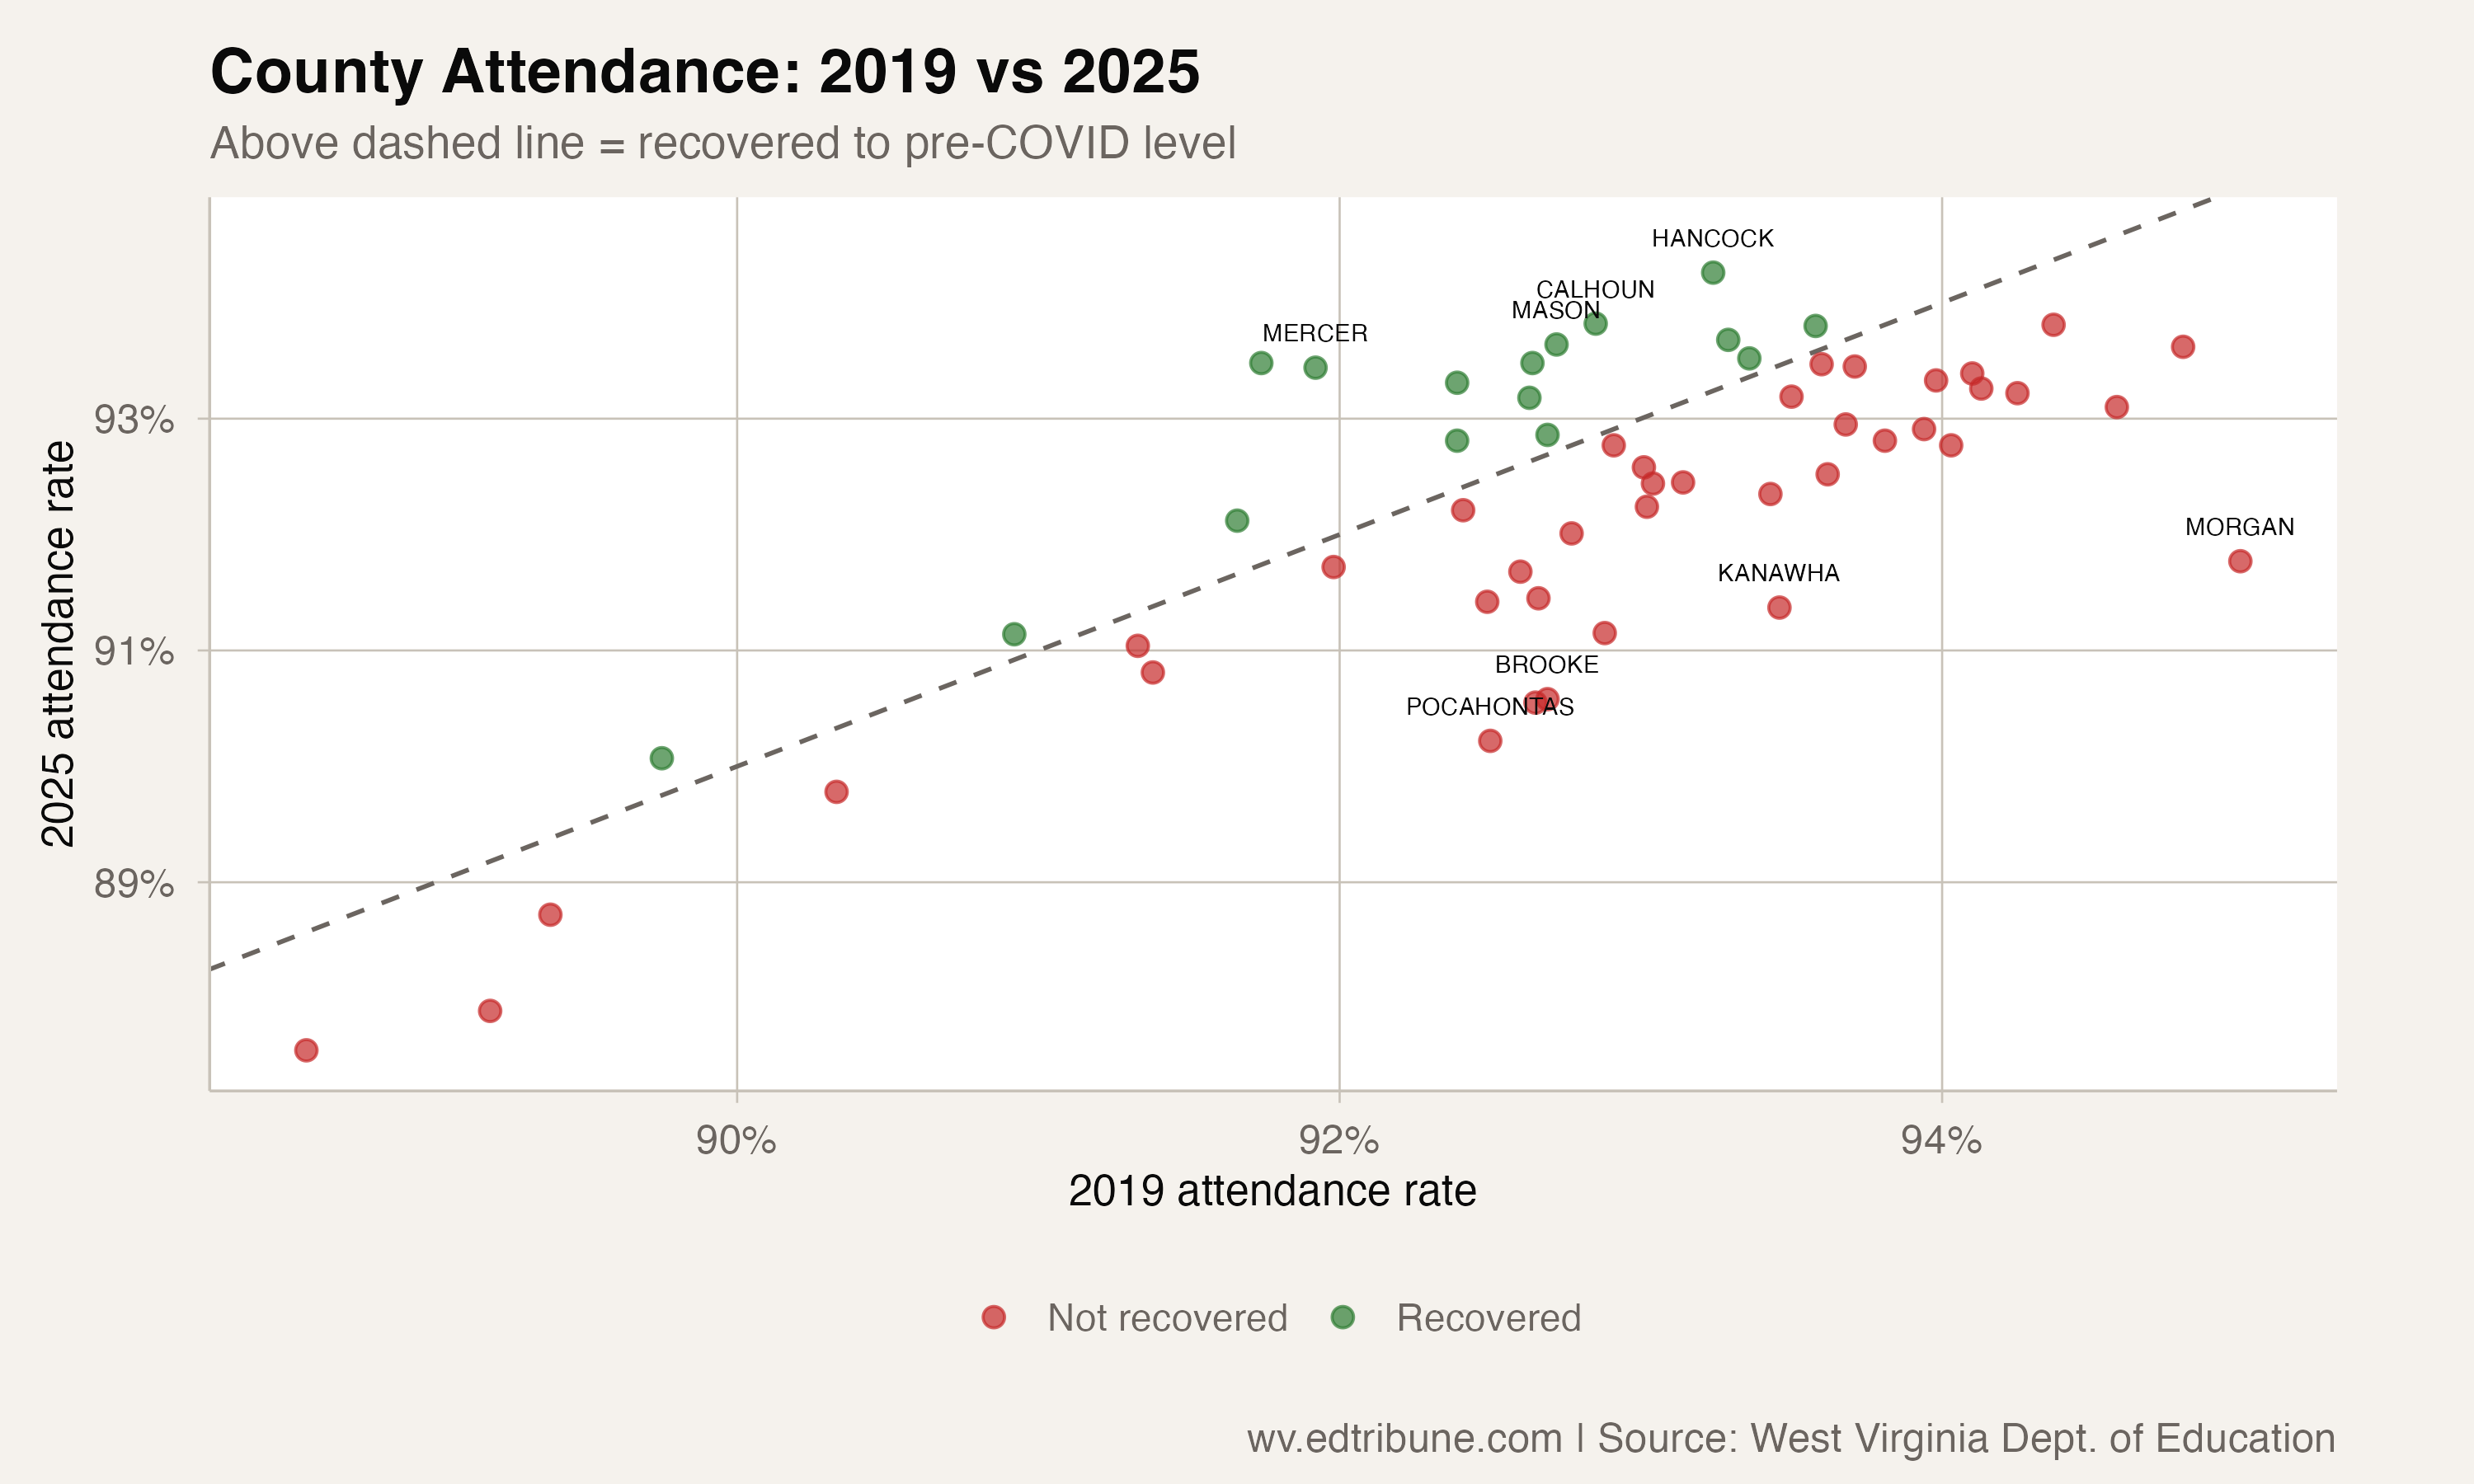
These are not uniformly poor or rural places. Kanawha is the state capital. Brooke is in the Northern Panhandle. The common thread is not geography: improvement has stalled or reversed after the initial recovery gains of 2023 and 2024.
Five counties going the wrong direction
Within the 39 non-recovered counties, five stand out: they are actually worse in 2024-25 than they were at the 2021-22 trough, the lowest point of the pandemic crash.
Pocahontas County fell from 91.6% at the trough to 90.2% in 2025, a decline of 1.4 points during a period when the state gained 1.4 points. With only 791 students, Pocahontas is small enough that a handful of disengaged families can move the needle, but the direction is unmistakable across three consecutive years.
Brooke County dropped from 91.1% to 90.6%. Kanawha fell from 91.9% to 91.4%. Raleigh County↗ET, the 6th largest with 9,156 students, slipped from 90.8% to 90.6%. Logan County↗ET, already the state's second-worst, edged from 88.0% to 87.9%.
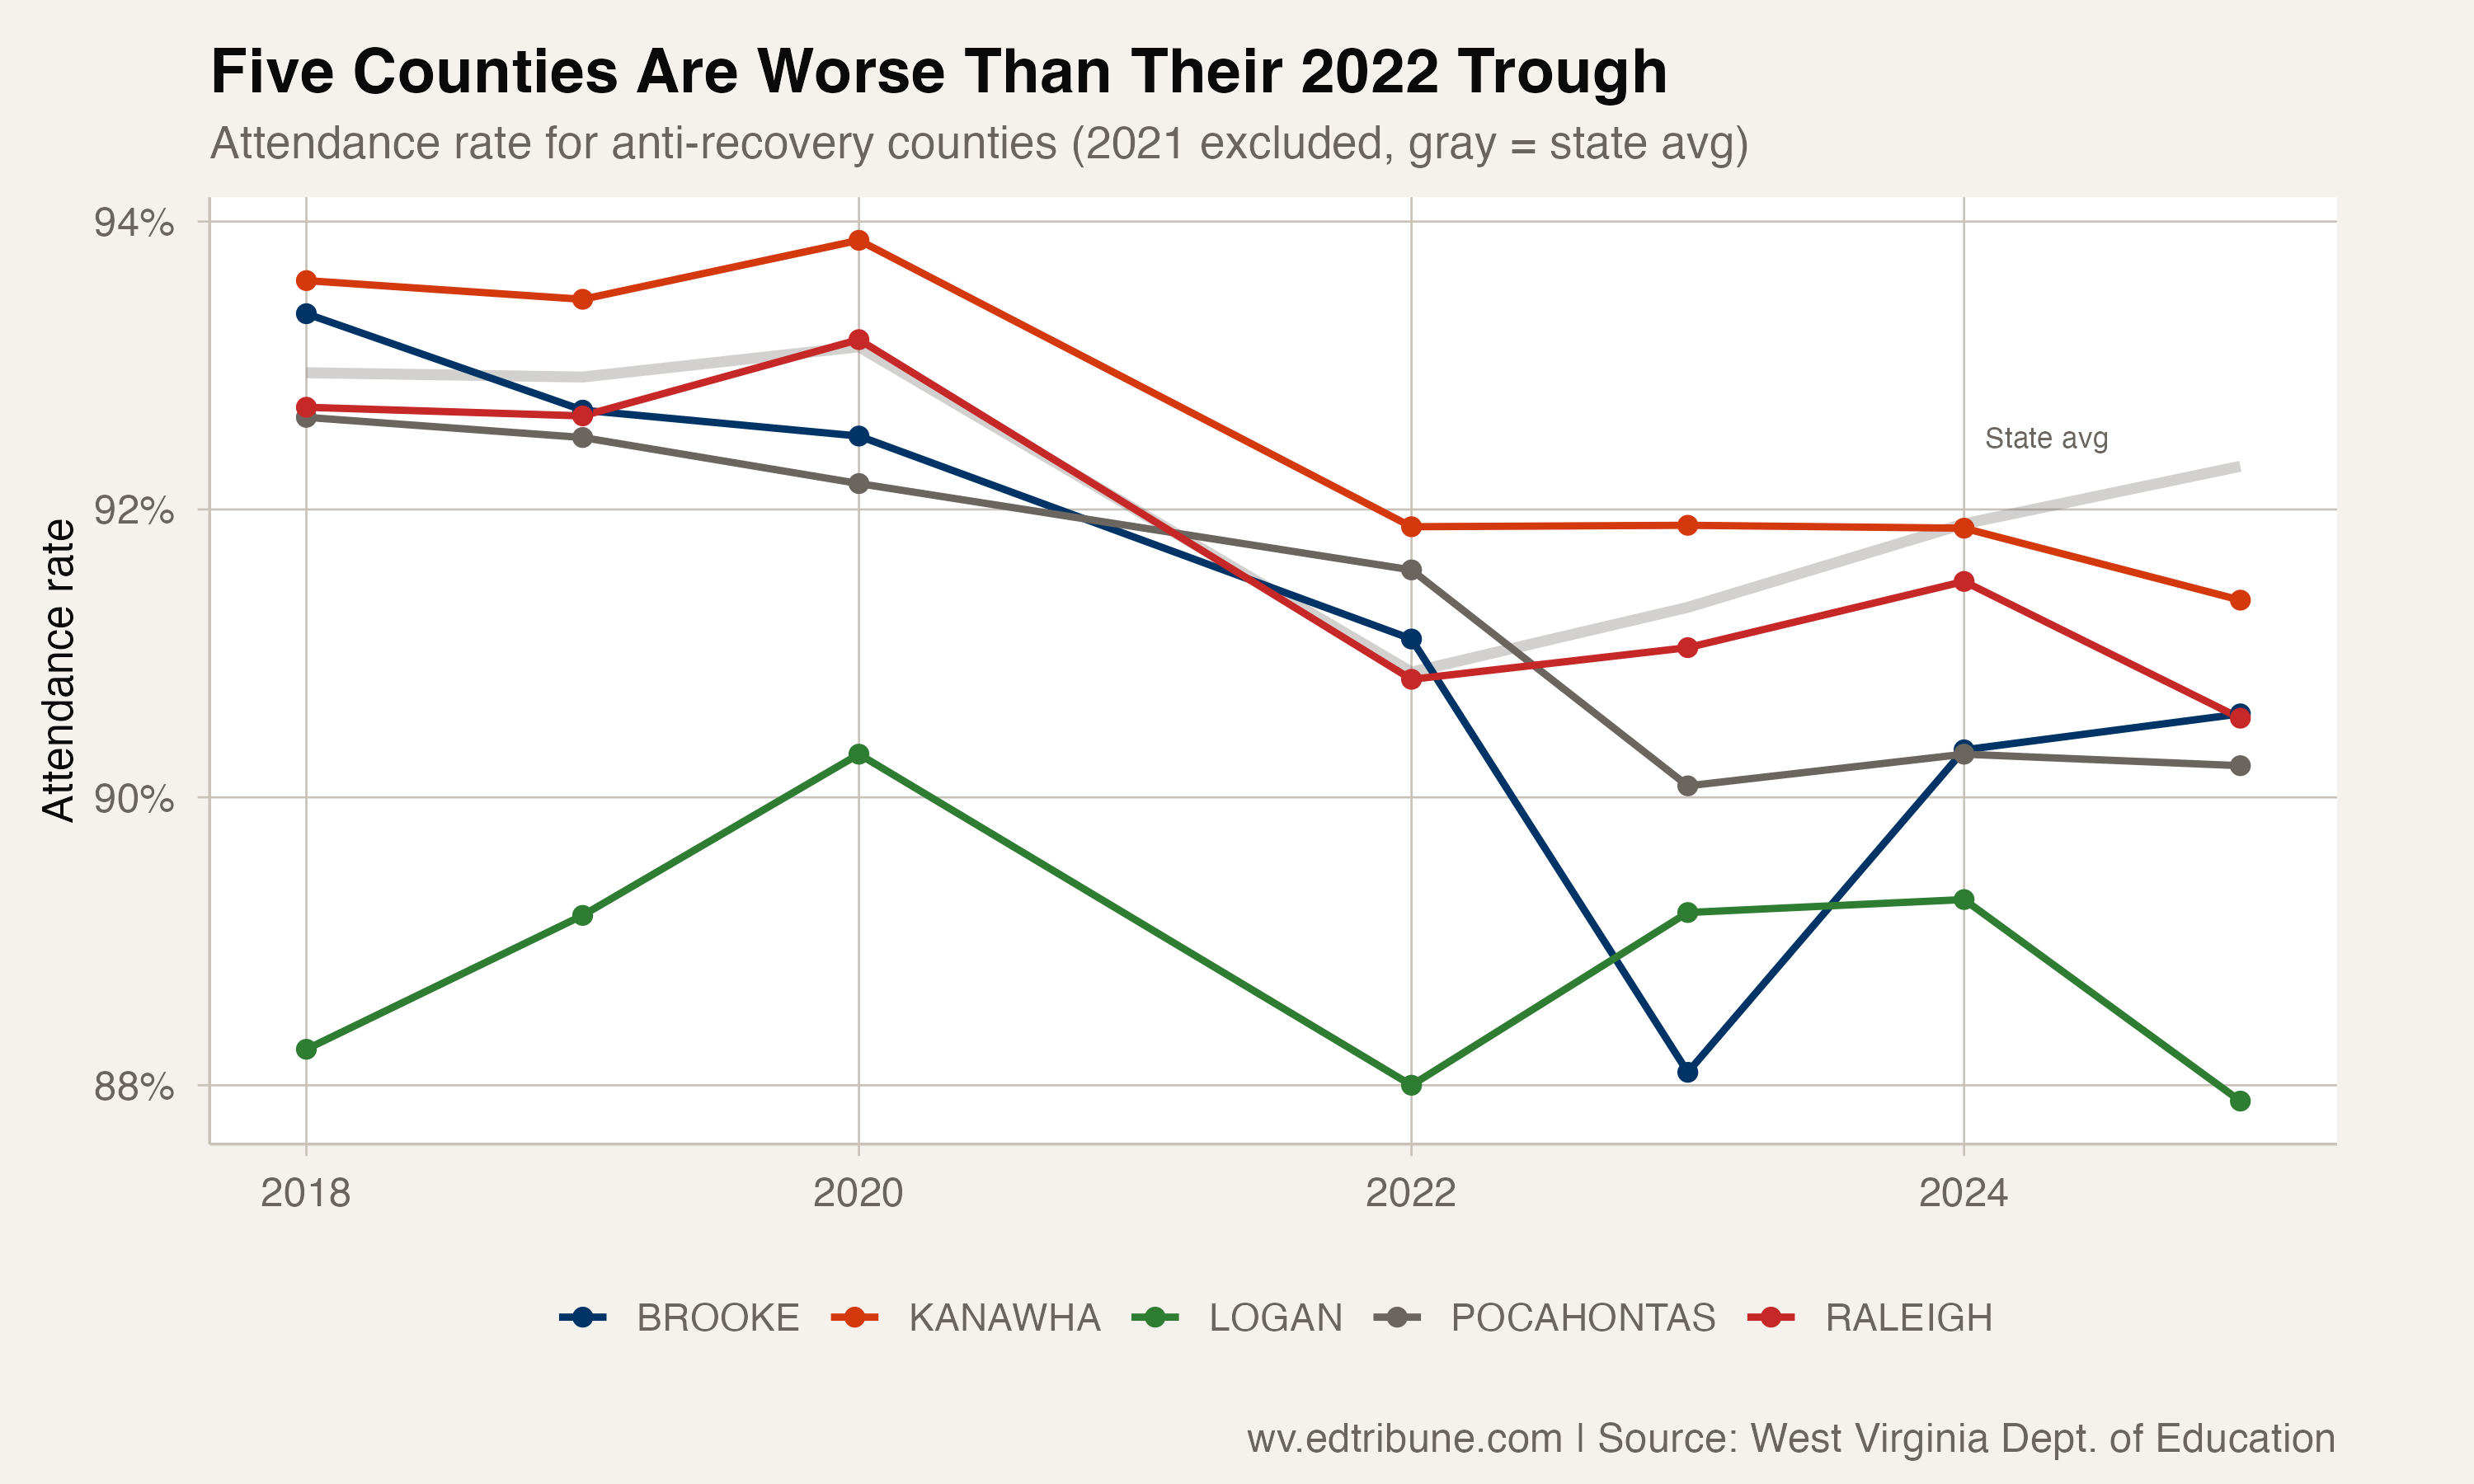
These five counties represent different sizes, regions, and economic profiles. Kanawha and Raleigh are among the state's largest; Pocahontas and Brooke are among the smallest. What they share is that whatever brought the state from 90.9% to 92.3% did not reach them, or reached them and failed.
The divide is not widening
One piece of structural good news: the spread between best and worst counties has returned roughly to pre-pandemic levels. The standard deviation across counties was 1.37 in 2019, spiked to 2.00 during the trough, and fell back to 1.49 by 2025. COVID stretched the distance between West Virginia's strongest and weakest counties, and that distance has mostly closed.
But closing the spread and closing the gap are different things. The spread narrowed because most counties moved in the same direction: upward. The fact that 39 counties are still below their own pre-COVID baselines, even as dispersion returns to normal, means the entire distribution shifted down. The counties recovered relative to each other. They have not recovered relative to where they were.
At 92.3% statewide and decelerating, the remaining 39 counties face a question of whether the final 0.6 points of recovery (and for many counties, more than 1 point) represents a solvable problem or a structural change in how families relate to daily attendance.
Detailed code that reproduces the analysis and figures in this article is available exclusively to EdTribune subscribers.
Discussion
Sign in to join the discussion.
Loading comments...