In this series: West Virginia Chronic Absenteeism.
George Washington High School in Charleston posted a 95.2% attendance rate in 2024-25, higher than the state average, and among the best high schools in West Virginia. Twelve miles south, Riverside High School posted 90.2%. Both are Kanawha County↗ET schools, drawing from the same district, the same funding formula, the same superintendent.
That 5-point spread within a single county captures the tension in Kanawha's attendance data. The county's 91.4% average in 2024-25 is an all-time low, the lowest in eight years of data, lower than the 2021-22 pandemic trough. But no individual school in the county dropped below 90%. The all-time low is not a crisis at any single building; it is a thin, systemwide erosion that compounds across 59 schools and 19,949 students.
A county moving opposite the state
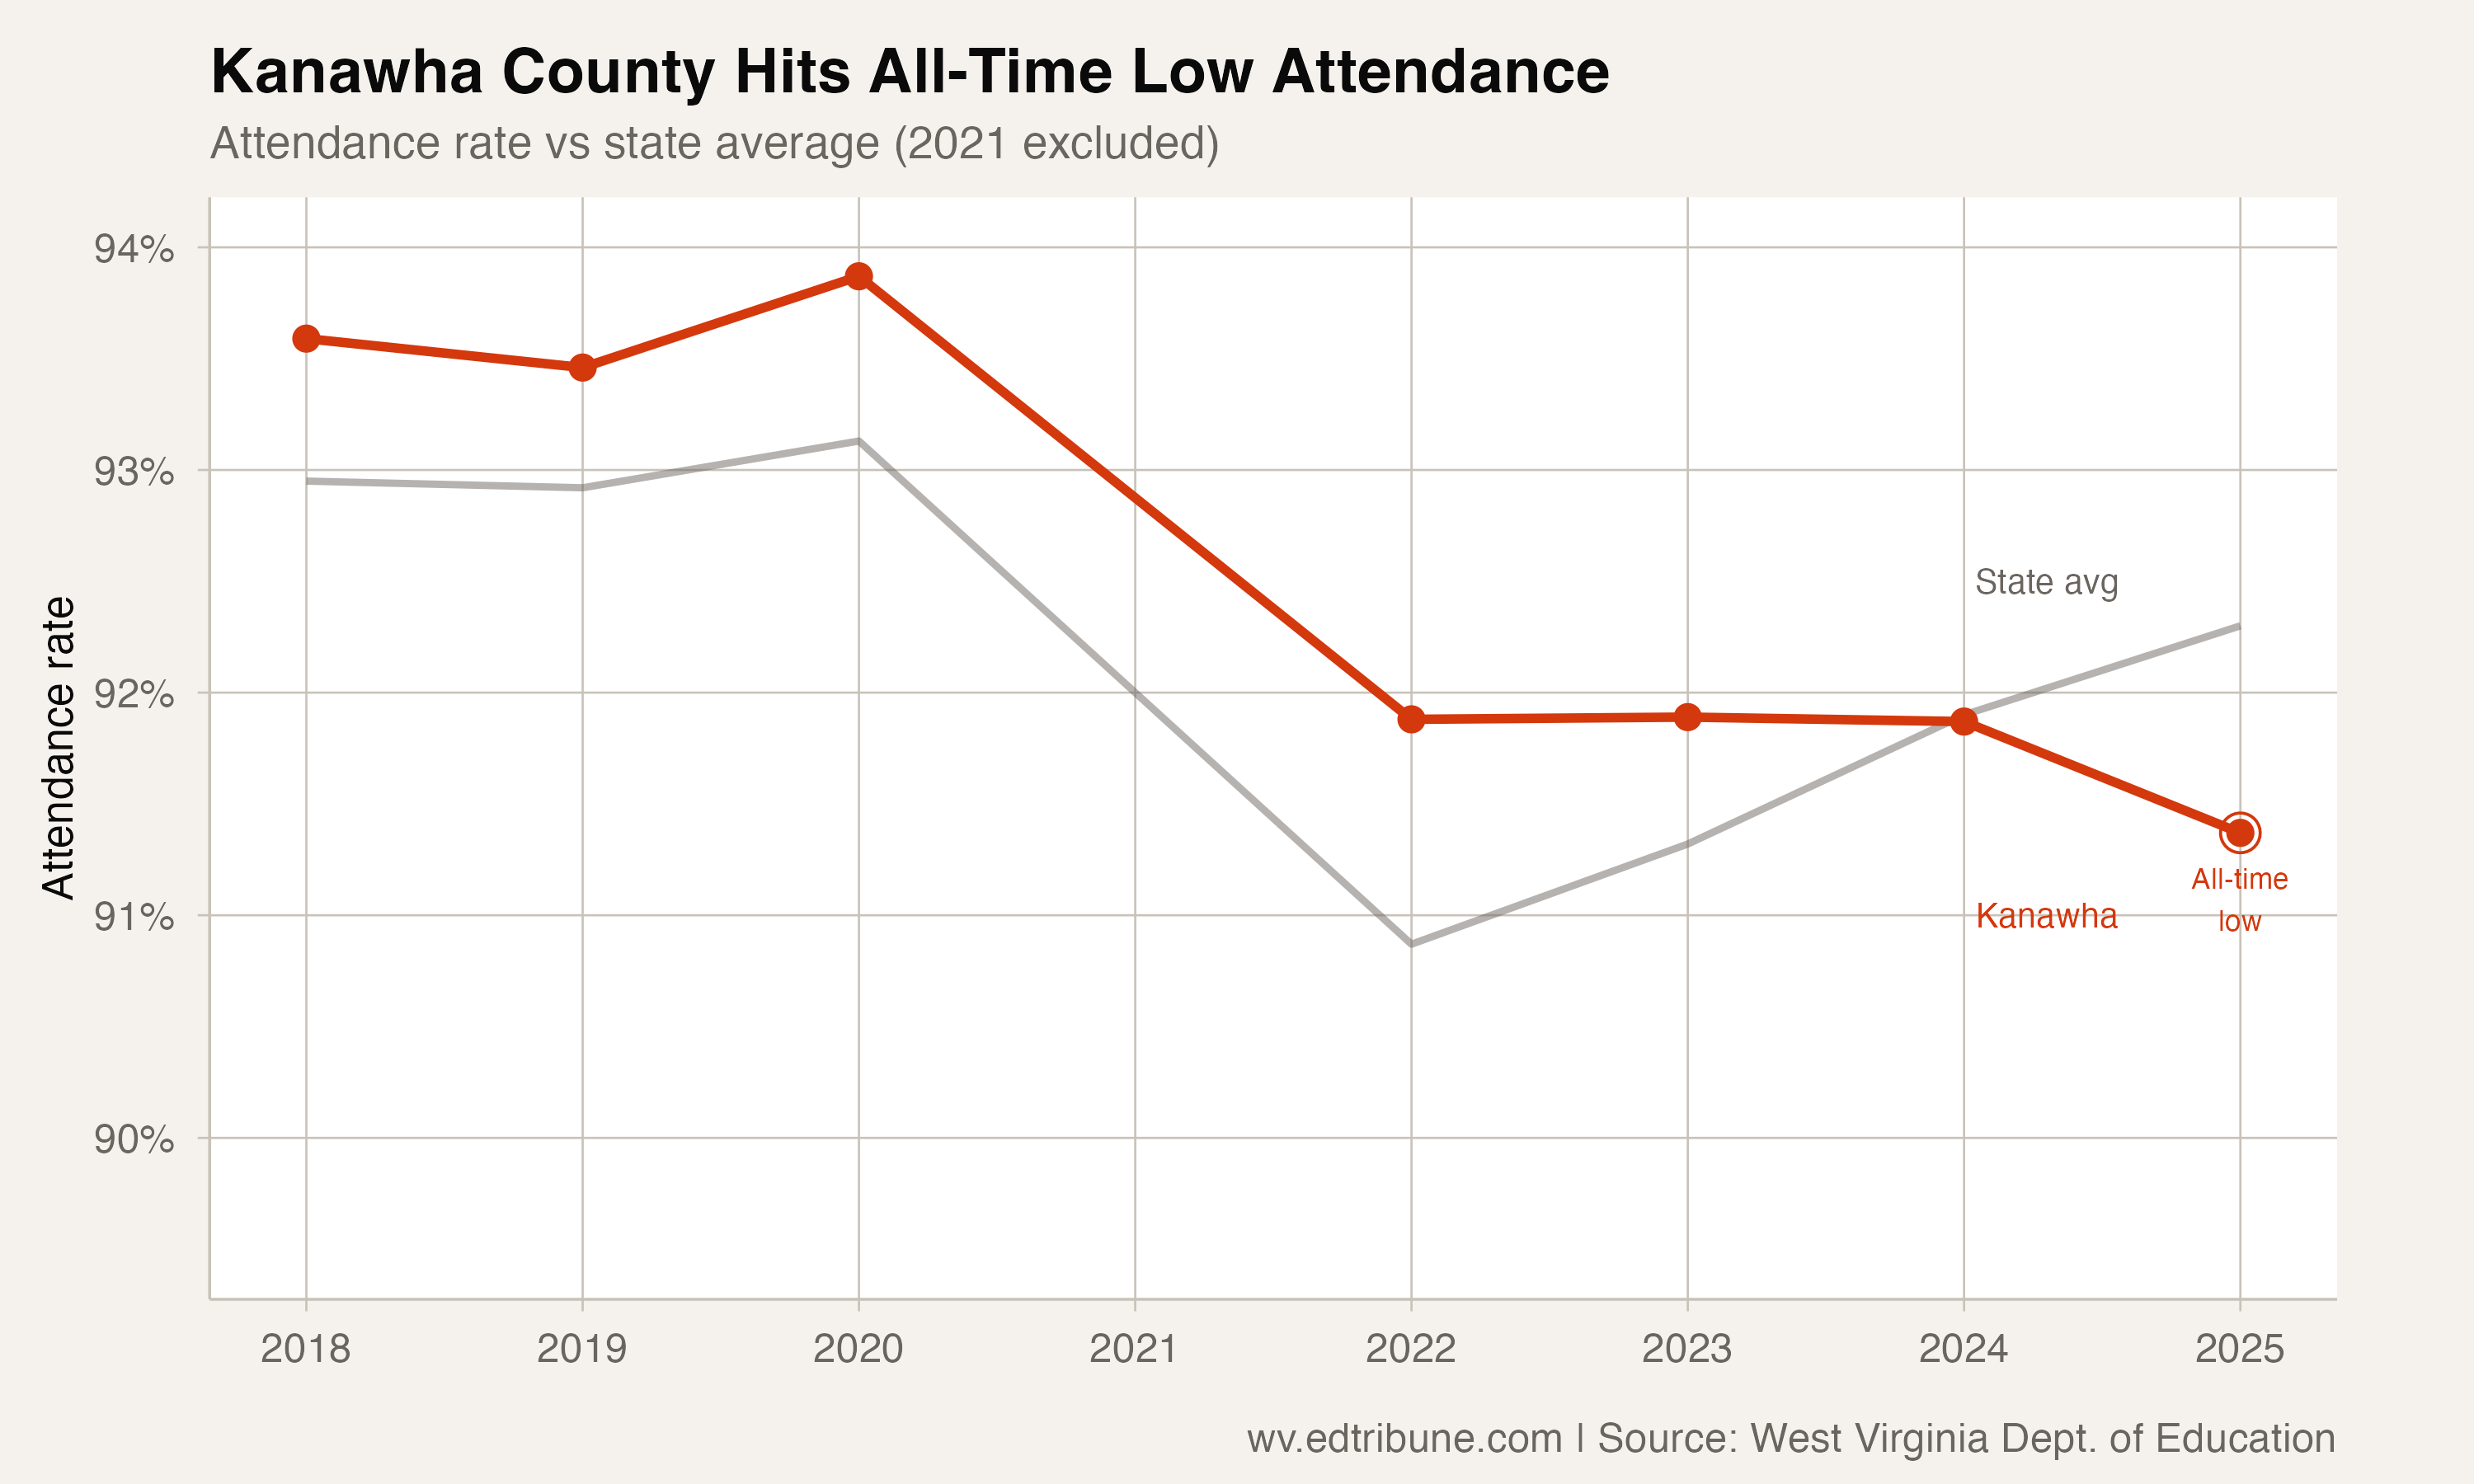
West Virginia's attendance has improved every year since the 2021-22 trough: 90.9% to 91.3% to 91.9% to 92.3%. Kanawha County went the other way: 91.9% in 2022, 91.9% in 2023, 91.9% in 2024, then 91.4% in 2025. Three years of stagnation followed by a decline.
Kanawha is one of five counties that are actually worse in 2024-25 than they were at the trough. The others (Pocahontas, Brooke, Raleigh, and Logan) are smaller and more rural. Kanawha, with nearly 20,000 students, is the state capital. It is where the legislature sits, where policy is made, and where the statewide attendance data is most visible. And it is going backward.
The county also lost 3,086 students since 2017-18, a 13.4% enrollment decline. The students who remain are attending less consistently than at any prior point.
The subgroup picture
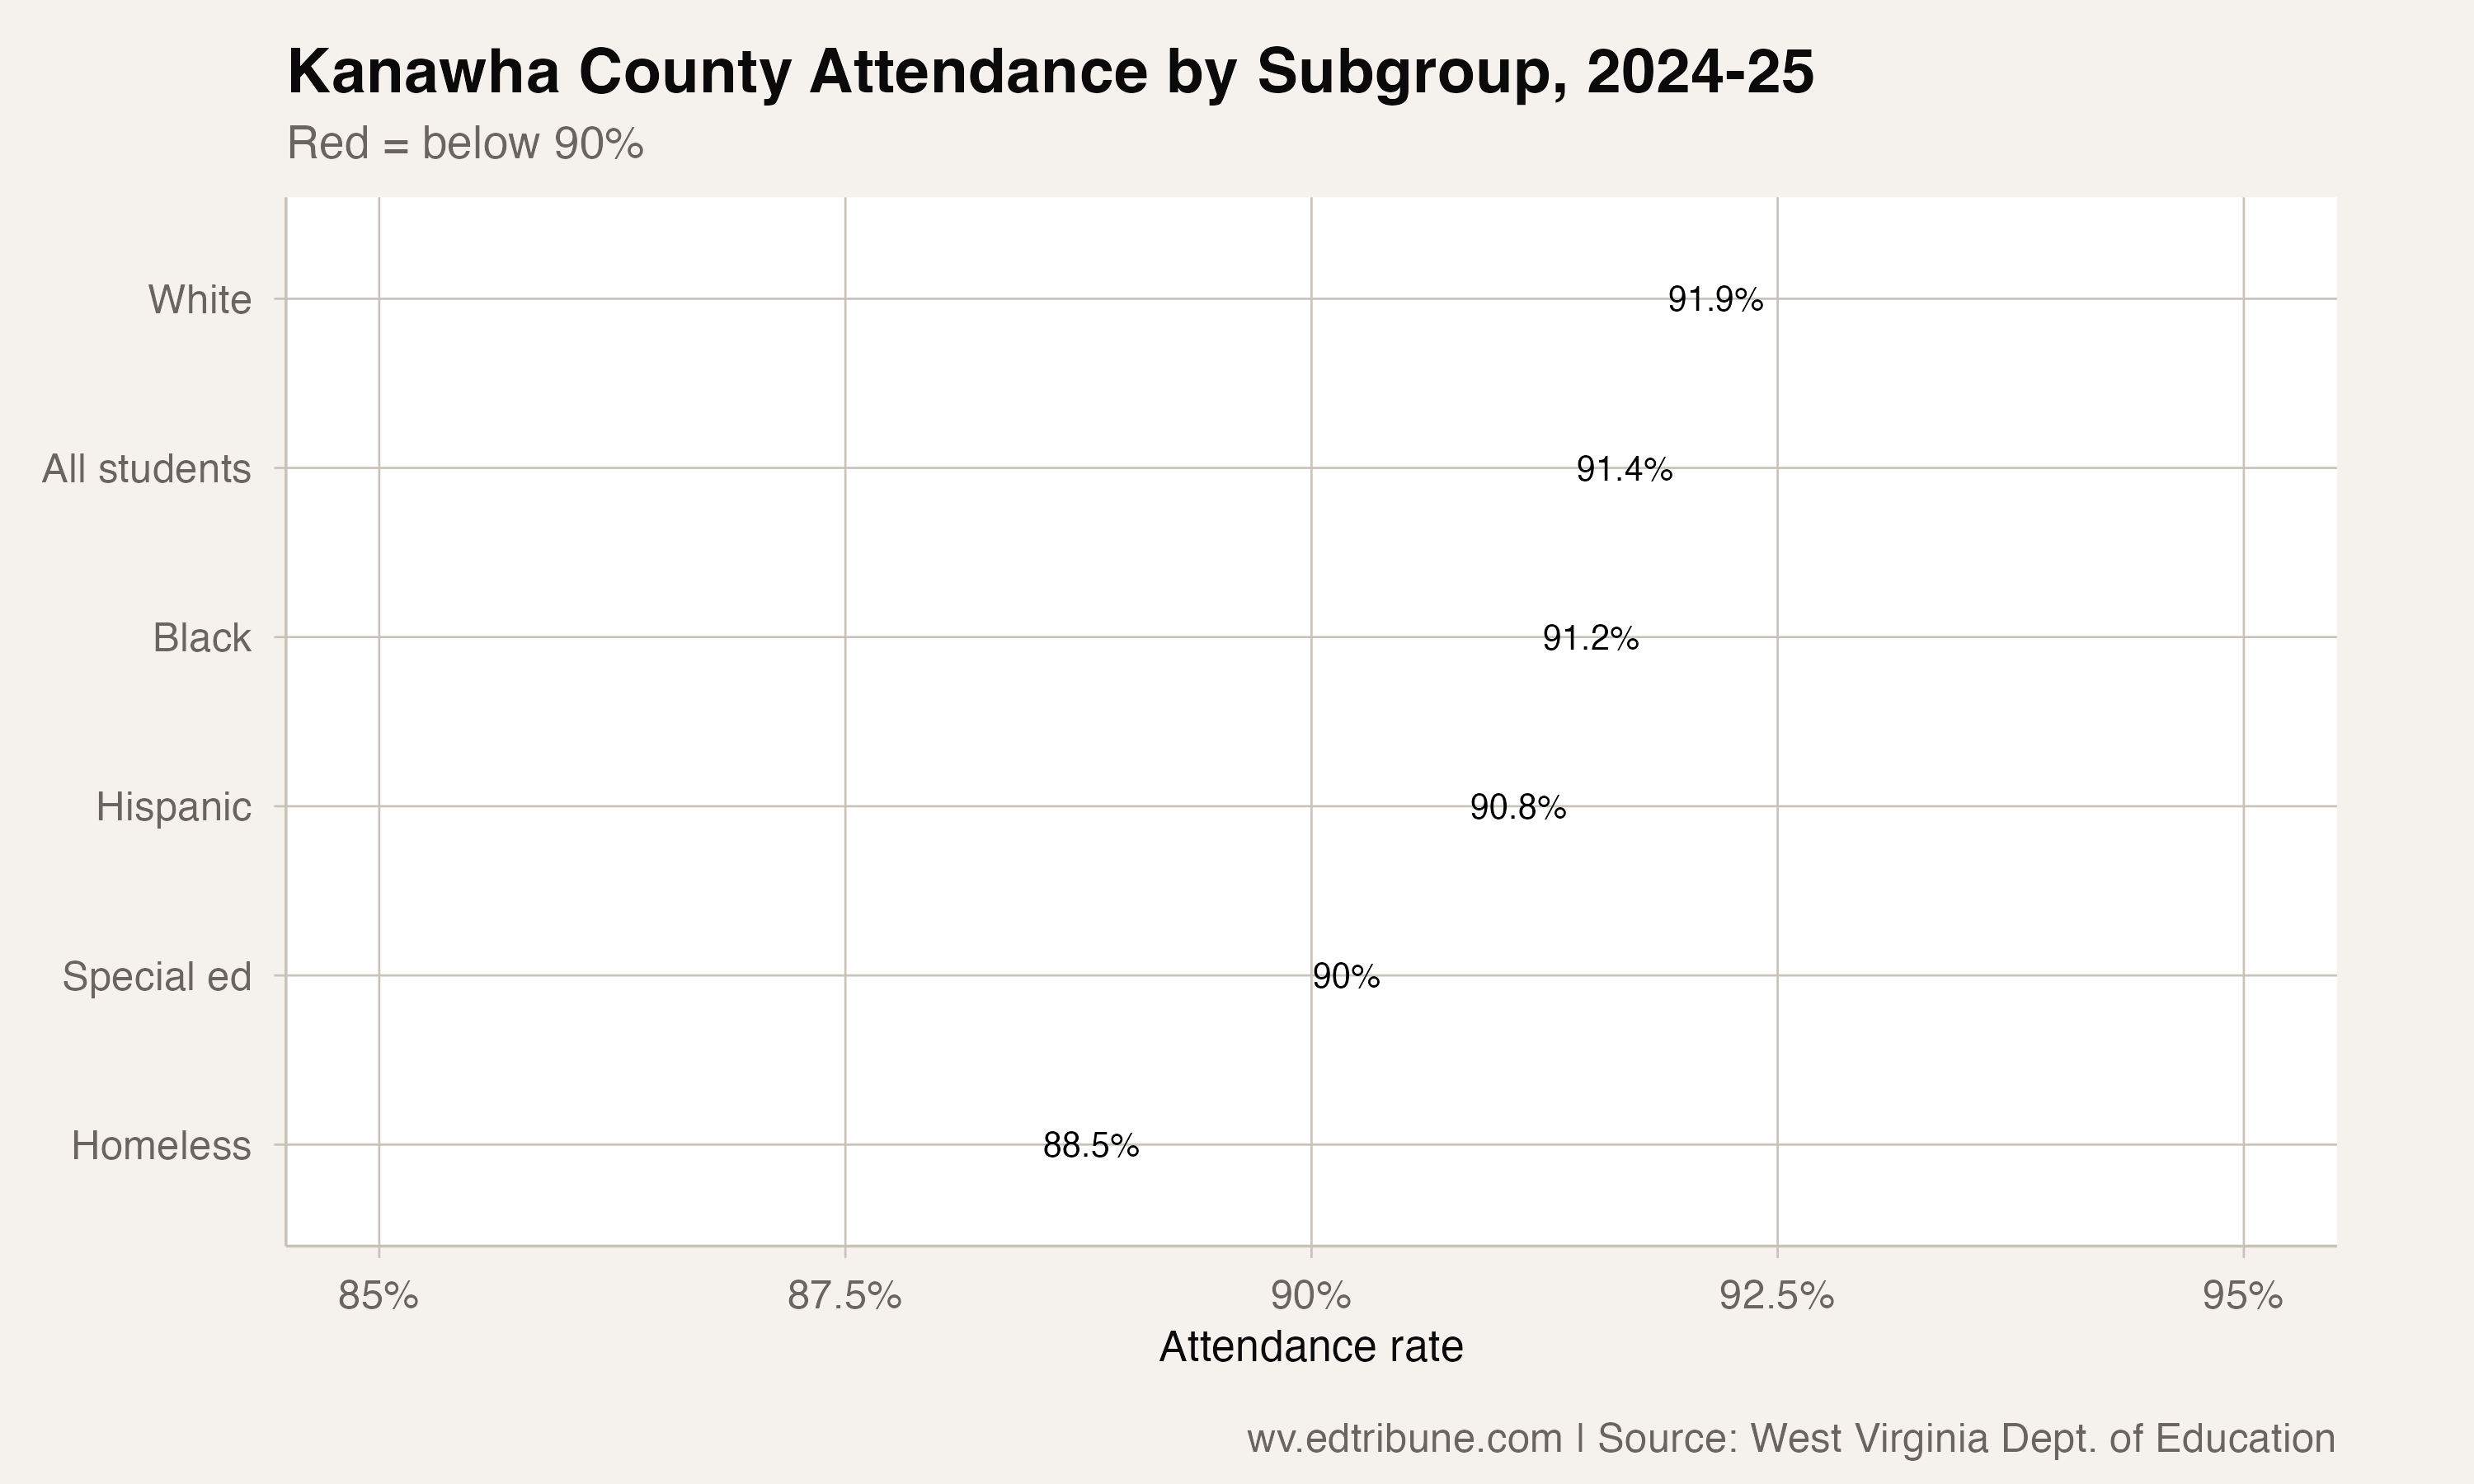
Homeless students in Kanawha attend at 88.5%, a 2.9-point gap below the county average. Their numbers have surged from 329 in 2018-19 to 828 in 2024-25, more than doubling. Special education students, numbering 4,292 (21.5% of enrollment), attend at 90.0%.
Black students attend at 91.2%, a gap of 0.2 points below the county average, small but persistent. Hispanic students, a tiny population of 129, attend at 90.8%.
The WV Gazette-Mail reported that chronic absenteeism in Kanawha County fell between 2023-24 and 2024-25, with roughly 700 fewer chronically absent students. Mary C. Snow West Side Elementary cut its chronic absenteeism rate from 30% to 18% through community partnerships. The chronic absenteeism metric (students missing 10%+ of enrolled days) and average daily attendance measure different things. It is possible for the chronic rate to improve while the average declines, if students in the middle of the distribution miss slightly more days.
Among the largest counties
Kanawha's 91.4% ranks eighth among the state's 10 largest counties. Only Cabell County↗ET (91.2%) and Raleigh County↗ET (90.6%) are worse. Putnam County↗ET, immediately adjacent and a destination for families leaving Kanawha, posts 93.2%.
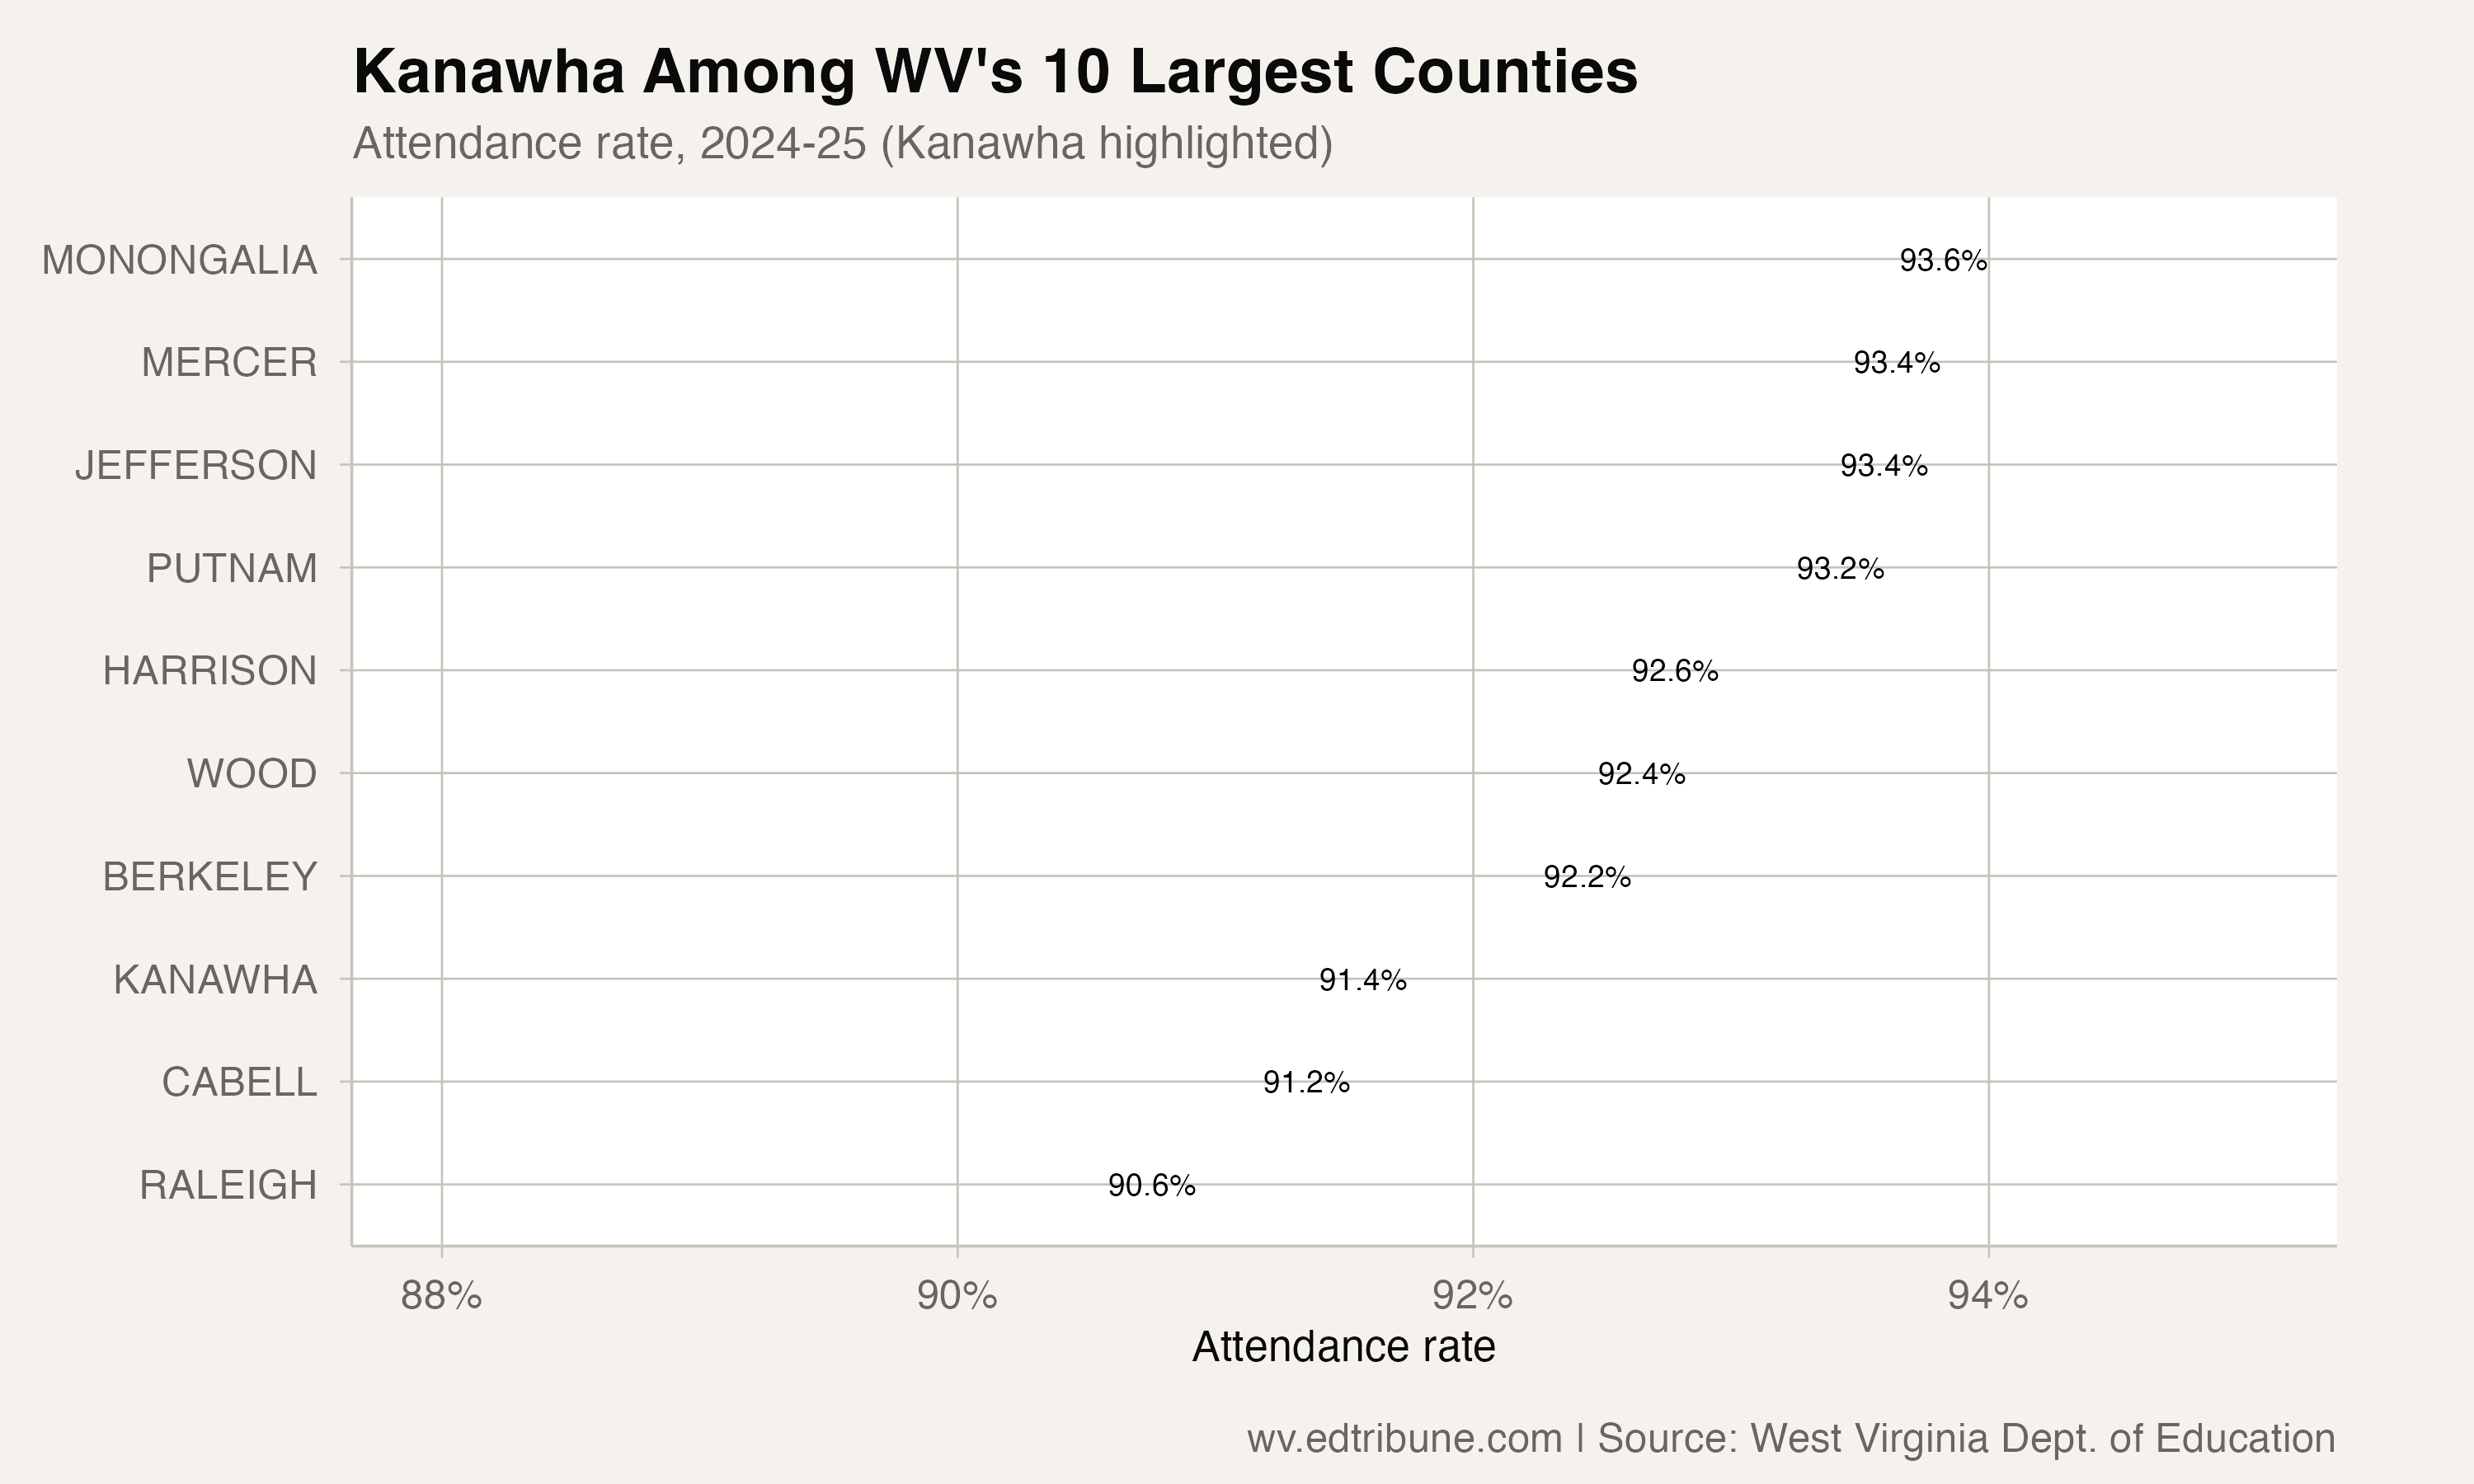
The Kanawha-Putnam gap of 1.8 points mirrors a pattern seen in the enrollment data: families with means and stability are shifting to suburban counties, while the students who remain in the core county face higher concentrations of poverty, homelessness, and special education needs. Putnam gained students while Kanawha lost them. Putnam's attendance held while Kanawha's declined.
A slow-motion trend
Unlike the coal counties, where attendance rates fell dramatically and visibly during the pandemic, Kanawha's decline has been gradual. The county was at 93.6% in 2017-18, above the state average. It fell to 91.9% at the trough, which at the time looked like a temporary disruption. But it never bounced back. Three years later, it slipped further.
The 2.2-point decline from 2017-18 to 2024-25 translates to roughly 4 additional missed days per student per year. Across 19,949 students, that represents approximately 80,000 additional student-days of missed instruction annually, the equivalent of one school's entire yearly attendance simply disappearing.
Whether this trajectory reflects a real change in attendance behavior, or the cumulative effect of enrollment decline removing higher-attending families from the count, is a question the data alone cannot answer. What it can say is that West Virginia's largest county, and the seat of state government, is at an attendance level it has never before recorded.
Detailed code that reproduces the analysis and figures in this article is available exclusively to EdTribune subscribers.
Discussion
Sign in to join the discussion.
Loading comments...